
COVID-19 – impact on shipping
COVID-19 – impact on shipping
1. Introduction
The recent and on-going global outbreak of the Coronavirus (COVID-19) has had a major impact on global shipping, affecting all shipping sectors from passenger ships to container ships and oil tankers. The coronavirus crisis escalated to unprecedented levels in Europe in March, with a severe impact on health, people and economy. Many countries have responded to the pandemic by imposing lockdowns or restricting movement. Since the start of the COVID19 crisis, the Commission, the Member States and the shipping industry have been taking measures to ensure the continuity of operations and thus the security of supply.
Coronavirus is an ongoing situation that is evolving day by day and the effects could be deep and long-term. What shipping will look like post COVID-19 is unclear; however, EMSA has the necessary data and tools to analyse the impact of the pandemic on certain shipping activities by analysing vessel traffic data and providing reliable figures to assist in the definition of the recovery policies and specific measures. These figures should assist all parties involved (EU, maritime administrations and shipping industry) in determining a recovery strategy to overcome the economic crisis that Europe is facing.
The objective of this report is to provide figures on the impact of COVID-19 on shipping traffic; it is based on solid vessel movements statistics showing the port call trends without interpreting the statistical data. The report could not serve the purpose of an economic impact analysis since the trade volumes are not available in the EMSA systems. The report focuses mainly on EU ports and EU flagged ships, but there are also statistics about the shipping routes from Europe to China and from Europe to the US have been affected.
For the purpose of this report, the term Member States refer to EU Member States, EFTA countries (Iceland and Norway) and the United Kingdom. The United Kingdom is included in the statistics since in 2019, the UK was still EU Member State and because during the transition period (due to end of 2020), the UK continues to report to SSN following the relevant EU rules.
The report is divided into sections presenting the impact in the following areas:
a. Ship calls at EU ports: Analyses information provided to the SSN system and focuses on traffic to EU ports. This section provides general statistics comparing ship calls in 2019 and 2020 as well as detailed statistics per ship type, per Member State and even per port (the 20 ports with top EU freight in 2018 were analysed).
b. Ships flying the flags of EU Member States: This section is based on information available in SSN and the LRIT DC crosschecked with MARINFO data (EMSA database fed by information bought from commercial providers). It analyses the impact of the COVID-19 outbreak on the activities of the fleets flying the flags of EU Member States.
c. EU – China and EU – US Traffic: This section analyses data on traffic intensity between the EU and China and between the EU and the US (irrespective of the flag of the ship) and identifies trends in 2020 in comparison with 2019. It is prepared based on MARINFO information.
d. Impact on cruise ships and other passenger ships: This section deals with the evolution in the number of cruise ships moored/at anchor and sailing in and around EU ports in the months between April and November 2020 and analyses the differences in PoB on passenger ships (2019 vs 2020). The analysis is done based on information provided by Member States to SSN (port call information, T-AIS).
e. Impact on vessel movement patterns: This section visually presents the impact to the traffic patterns per ship type and EU region based on the methodology adopted by the SSN High Level Steering Group and the Traffic Density Maps (TDM) produced by EMSA. Since these maps are issued on a monthly basis this section is only updated in the first report of the month.
f. Congestion at anchorages in EU waters: Based on AIS navigational status data, this section shows how the number of ships at anchor has increased during the COVID-19 crisis.
2. Executive summary
With international transport at the forefront of trade and dependent on travel and human interaction, the shipping industry has been impacted both directly and indirectly from the outbreak of COVID-19. Using data mainly from the Union Maritime Information and Exchange System (SafeSeaNet1 ), and in certain cases combined with LRIT and MARINFO data, EMSA issues a report providing figures on the impact of COVID-19 on shipping traffic. The report is based on solid vessel movements statistics2 showing the port call trends without interpreting the statistical data.
By analysing ship calls at EU ports it was found that the number of ships calls at EU ports declined by 13.3% in the first 44 weeks of 2020 compared to the same period in the previous year. The number of ships calls in week 44 only (26 October – 01 November) declined by 5% compared to the same week in 2019. The most significantly affected sectors have been the Chemical tankers, Cruise ships and Passenger ships. Meanwhile, the number of Bulk carriers, Containerships, General Cargo, Oil tankers, and Ro-Ro cargo vessels had only a small decrease (up to 5%).
The most affected countries are Croatia, Iceland, Slovenia and Spain. The declines in number of ship calls between 2019 and 2020 is attributed to the Cruise and Passenger coastal ships traffic which has been heavily affected by the crisis. The detailed statistics on impact on ship calls to EU ports per Member State, per ship type and even per port can be found in section 3.
By processing data from MARINFO for 2019 and 2020, the EMSA report analyses also the impact of the COVID outbreak on the activities of ships flying the flags of EU Member States in terms of calls at any port in the world. A decrease of port calls worldwide by EU flagged ships was observed from the first half of March to October 2020, compared to the same weeks in 2019; a big decrease was observed for cruise and vehicle carriers. Since end of July (i.e. week 30), port calls (worldwide) from EU flagged passenger ships have shown an increase in comparison to the same weeks in 2019; similarly, since week 28 (mid-July) EU flagged Ropax traffic has shown a positive trend (in terms of number of port calls worldwide) compared with the same period in 2019. The detailed figures are available in section 4.
EMSA also analyses how the shipping routes from Europe to China and from Europe to the US have been affected. From March to October 2020, the ship traffic from Europe to China and the US has declined when compared to same periods in 2019. Comparing weeks 1-44 in 2019 and 2020 there is a significant decrease of 50.8% from Europe to China, while the traffic flow from China to Europe showed a decrease of 37.1%. Comparing the same period of 2019 and 2020 for the traffic between Europe to the US a decline of 31.2% was measured while for the routes between the US to Europe the decline was even more significant reaching to 38.6%. For more details please refer to section 5 of the report.
The EMSA analysis put focus on ships carrying passengers (Cruises, Passenger ships and RoRo/Passenger) which were mostly affected by COVID-19. EMSA started already in March with the analysis of cruise vessels related data producing daily a status report with the list of the cruise ships located at EU ports (moored or at anchor) and the list of sailing cruises destinated to EU ports in the coming days. This analysis showed the growing number of cruise ships bound to EU ports and staying at ports or anchorages. The report showed that the number of Persons on Board (PoB) on cruise ships began to decrease gradually from the beginning of March (around week 10) and remained at a very low level corresponding mainly to crew members on board these ships. Every major cruise line in the world suspended departures in mid-March as the coronavirus outbreak grew, with some returning to operations in limited number of vessels and areas.
As the COVID-19 pandemic continued to roll, ports have faced an unprecedented number of vessels at anchor and vessels queue up waiting for a spot to unload cargo. Since the beginning of 2020 and especially since week 13 there is an increase number of ships “at anchor” in comparison with 2019.
The EMSA report demonstrated that the cruises sector and in general the transport of passengers are the sectors most heavily impacted by the COVID-19. Other sectors were also impacted, but in general the trade didn’t stop. Despite of the difficulties, commercial ship operations, ports and other maritime transport sectors continued to operate ensuring the movement of goods and proving the strategic importance of maritime for our livelihoods.
3. Impact on ship calls to EU ports
This section analyses the impact of COVID-19 on ship calls at EU ports. These statistics have been prepared based on ship call information provided by Member States to SafeSeaNet in 2019 and 2020 (up to week 44). Only confirmed ship calls (i.e. ship calls for which MSs reported Actual Time of Arrival) have been extracted from SSN and grouped per week3 . The ship types have been retrieved from the MARINFO database based on IMO numbers reported to SSN.
3.1 General statistics
During the first 44 weeks of 2019, there were 760,903 ship calls at EU ports, and in the same period in 2020 there were 660,071 ship calls. The number of calls decreased by 13.3% in comparison with 2019.
The table below shows the number of ship calls per week in 2019 and 2020 and the trends between these years.
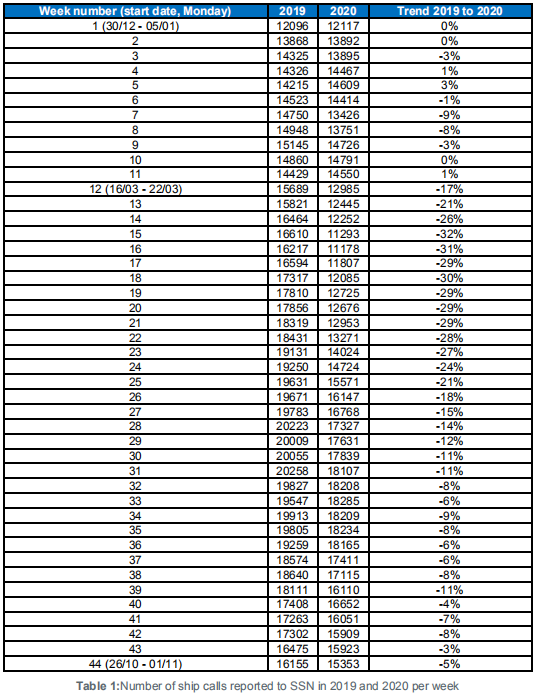
The significant decrease in the number of ship calls began in week 12 (16-22 March). This was the week after the WHO declared the COVID-19 outbreak a pandemic (12 March 2020).
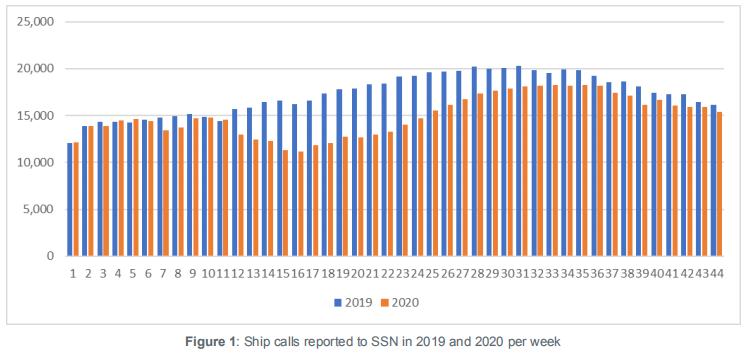
The graph below shows the comparison of the number of ship calls per week in 2019 and 2020:
3.2 Statistics per ship type
The COVID-19 outbreak impacted ship traffic due to:
• the limitations in movements of passengers and crew members (heavily affecting passenger ships), and;
• the lockdown measures in various Member States, reducing international trade.
This section presents the impact of COVID-19 on different ship types. Ship calls have been extracted from SSN and ship types retrieved from the MARINFO database using the IMO numbers reported to SSN for cross reference purposes. The table below shows the comparison in the number of ships calls per week in 2019 and 2020 for the selected ship types:
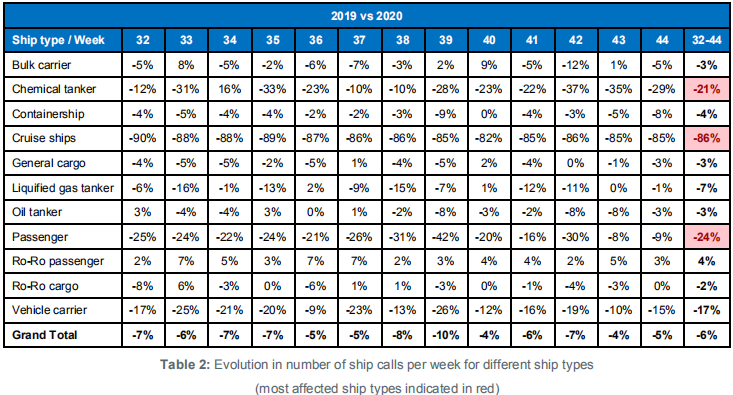
By comparing the number of ship calls between weeks 32 and 44 reported in 2019 and in 2020, it was found that cruise ships, passenger ships and chemical tankers are the ship types for which the highest decrease in ship traffic has been detected.
3.3 Statistics per Member State
This chapter presents the impact of COVID-19 on Member States. The table below shows a comparison of the numbers of ship calls per week in 2019 and 2020. The statistics focus only on the number of ship calls at Member States ports and does not refer to cargo transported (information not available to EMSA).

The last column compares the number of ship calls reported between weeks 32 and 44 in 2019 with the ones reported in the same weeks in 2020 (week 32 in 2020 started on 09 August).
For Malta, only data between weeks 32-38 was analysed because the figures since week 39 are not available due to IT technical problem in the National Maltese SSN system.
The most affected countries are Croatia, Iceland, Slovenia and Spain. This declines in number of ship calls between 2019 and 2020 is attributed to the Cruise and Passenger coastal ships traffic which has been heavily affected by the crisis.
3.4 Statistics per port
This chapter shows the impact of COVID-19 on 20 EU ports which, according to Eurostat, were the top 20 EU freight ports in 2018. The following table shows the comparison of the numbers of ship calls per week in 2019 and 2020, and this confirms that there has been a decrease in ship traffic at most ports.

The last column (32-44) compares the number of ship calls reported between weeks 32 and 44 in 2019 with those reported in the same weeks in 2020 (week 32 in 2020 started on 09 August).
By comparing numbers of ship calls between weeks 32 and 44 reported in 2019 and in 2020, it was found that Algeciras, Barcelona, Le Havre, and Marseille are the ports with the highest decrease in ship traffic.
4. Impact on ships flying the flags of EU Member States
This section analyses the impact of the COVID-19 outbreak on the activities of ships flying the flags of EU Member States. The port calls of those ships, at any port in the world, have been counted week-by-week and compared with equivalent periods in 2019.
These statistics have been built processing data from MARINFO for 2019 and 2020 (up to week 44) crosschecked with LRIT data. Specific ship types that appear to be more relevant for international trade for this analysis were considered. The specific ship types have been aggregated under major ship categories.
4.1 General statistics
The total number of calls (at all ports in the world) by vessels flying the flags of EU Member States decreased in March, April, May, June and July 2020 in comparison with the same period in 2019. In particular, the decrease started in mid-March, during weeks from 12 to 30 (i.e. the second half of March, April, May, June and July). This trend appears to be an impact of the COVID-19 outbreak escalation across Europe that obliged many EU Member States to put in place lockdown measures from mid-March.
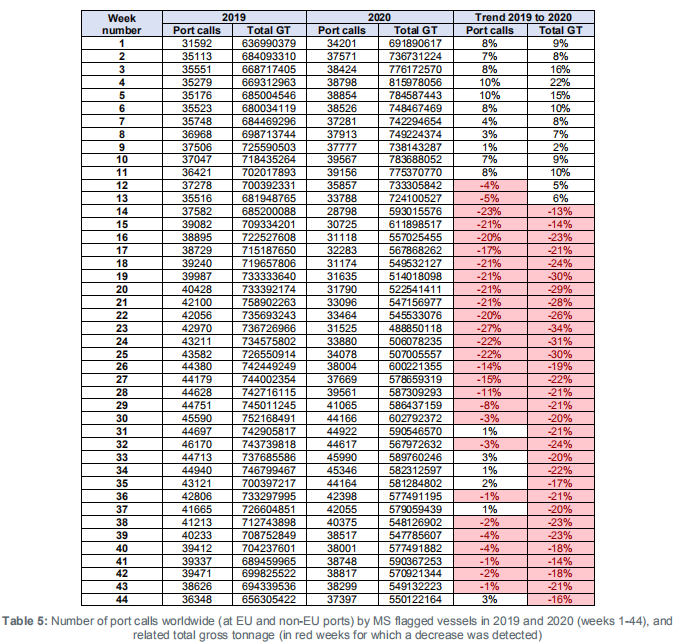
After small decreases in the previous six weeks (i.e. 38, 39, 40, 41, 42 and 43), in the last week (i.e. 44) the number of port calls worldwide by vessels flying the flags of EU Member States slightly increased again compared to the same week in 2019, like in weeks 31, 33, 34, 35 and 37. These figures seem to indicate a tendency for the EU flagged traffic to pick-up to a standard behaviour.
The analysis per flag is shown in Table 6. The last column compares the number of port calls (worldwide) reported between weeks 12 (i.e. mid-March) and 44 in 2019 with the ones reported in the same weeks in 2020. A reduction in the number of port calls (worldwide) is observed for almost all the EU-MS flagged fleets; the highest decreases in traffic (in percentage terms, in the period within weeks 12 and 44) are observed for ships flying the flags of Croatia, Spain and Poland.

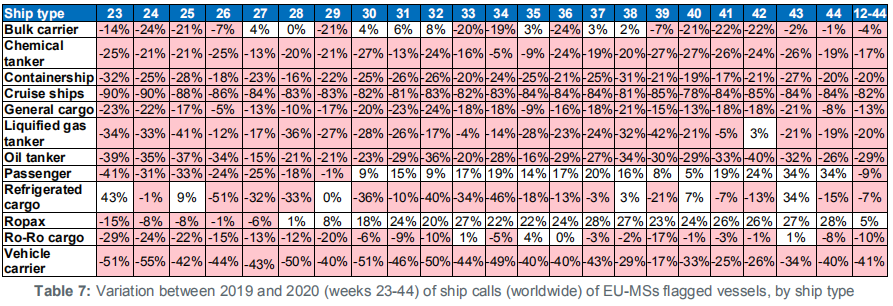
4.2 Statistics per ship type
EMSA analysed the variation between 2019 and 2020 in the total number of port calls (worldwide) by EU-MS flagged vessels by ship type and week. The vessels have been grouped following the ship type aggregation. The COVID-19 outbreak and the lockdown restrictions have had an impact on EU-MS flagged fleets from the end of March 2020 for all ship types.
Starting from the second half of March 2020, a reduction in activities (in terms of calls at any port in the world) compared to 2019 has been seen, especially for some ship types, such as cruise and vehicle carriers (see last column of Table 7) . While all EU flagged ship types experienced reductions in calls worldwide since the 2nd half of March, major variations compared with equivalent periods in 2019 can be observed for cruise and vehicle carriers. Since week 30 the number of port calls (worldwide) from EU flagged Passenger ships has shown an increase in comparison to the same weeks in 2019; similarly, starting from week 28, it was observed a positive trend for the EU flagged Ropax traffic, in terms of number of port calls (worldwide) compared with the same period in 2019.
5. EU – China and EU – US traffic
5.1 Introduction and methodology
Statistics on the traffic between EU and China (irrespective of ship flags) were analysed in order to identify trends in 2020 in comparison with 2019. The analysis is based on ship calls in Europe by ships which had previously called at any Chinese port approximately one month before (a reasonable travel time for a ship journey from China to Europe). The same was calculated for the opposite direction (i.e. from European ports to Chinese ports).
To assess the type of trade that was most affected, these calls were segregated by ship type. Container ships are by far the most frequent ship type sailing between China and Europe, making them the most interesting to assess during the outbreak. For a cargo ship, the voyage duration between China and Europe depends on the route, ship type and speed of the ship. The average time is between 30 and 33 days but for this analysis a voyage duration of 33 days was used.
EMSA applied the same methodology to assess port calls by ships engaged in trade between Europe and the United States of America. In this case the expected voyage duration was set to 10 days.
EMSA recognises that the calculation of the number of ship calls (incoming and outgoing traffic in Europe) provides an indication of import/export volumes, but that it does not provide a safe indication of the real direction of the traded goods. The data available in MARINFO do not indicate whether a ship is loading or unloading, or both, or the volumes and values of the traded cargo.
Nevertheless, this methodology can show the traffic trends in 2020 and 2019, since any inaccuracies affect the calculations of both years in the same way.
5.2 General picture between Europe and China/US
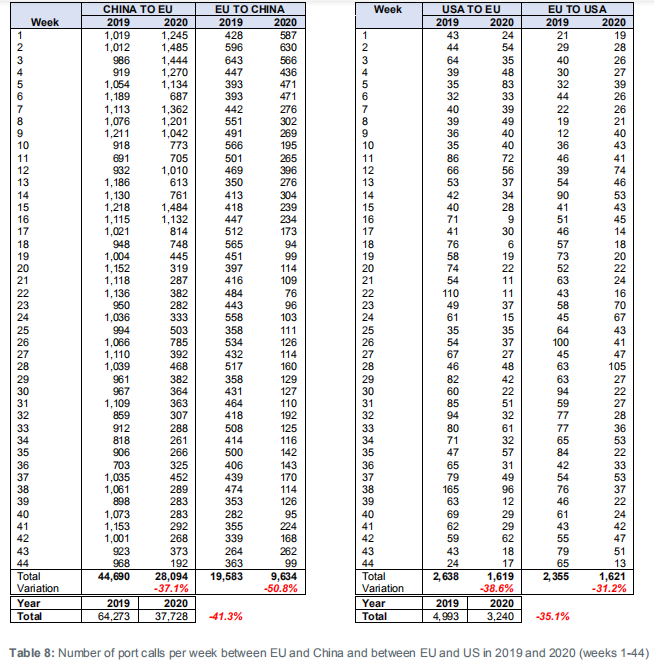
From the number of port calls, it appears that in certain periods, particularly during March, April and May 2020, ship traffic from Europe to China and the US reduced in comparison to the same periods in 2019. However, to better set the scene, and before looking at the weekly evolution of port calls, it is important to first compare the overall calls made up until week 44 (26 October – 01 of November 2020) with the figures for the same period in 2019, in order to see the broader picture and get an indication of the external EU shipping trade (i.e. from and to China and the US).
The analysis of the traffic from China to Europe is reduced by 37.1%, while from Europe to China, there is a more significant decrease of 50.8%. There is a general decrease in the number of port calls from China to EU ports from March 2020 onwards, however, in January 2020 the EU ports received more calls from China when compared to January 2019. This is perceived in all ship’s types and not limited to a certain type of ship.
A similar exercise was made for port calls with the United States of America, since the US represents the most important destination of goods exported by the EU4 . The number of port calls by ships trading between the EU and the US are much lower compared to the equivalent calls for the EU and China, but not necessarily the traded volumes and especially the value of the goods.
A decrease of 31.2% in port calls by ships travelling from Europe to the US was observed and the number of port calls from the US to Europe decreased by 38.6%. Table 8 shows the number of EU - China and EU – US ship calls in 2019 and 2020 (weeks 1-44).
The number of port calls decreased for both destinations and directions in March, April and May 2020 compared to January and February 2020, with signs of slight improvement in July and August 2020. This is especially evident for calls in China by ships coming from ports in Europe.
Port calls in Europe by ships coming from ports in China increased during the first two months of 2020 when compared with 2019. A reduction started in week 9 (end February) with an exception in weeks 15 and 16 (this might not be correct due to the methodological limitations).
5.3 Trade between China and Europe by ship type
The main ship types engaged in trade between Europe and China were container ships, vehicle carriers, general cargo, gas carriers and bulk carriers.
Table 9 shows the total number of port calls per ship type from China to Europe and vice versa for 2019 and 2020 (comparing the equivalent period from week 1 to week 44).
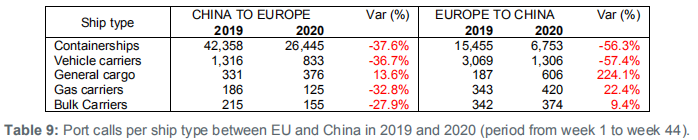
The number of ship calls from EU to China increased for general cargo ships, gas carriers and bulk carriers, and decreased by 57.4% for vehicle carriers and by 56.3% for container ships, which represent the most important type of ship used for trading goods between China and Europe (as shown in the table, the number of calls for container ships is substantially higher compared to the other ship types). In the opposite direction, that is from China to Europe the reduction in the number of port calls for containerships has registered a much slighter reduction of 37.6% and of 36.7% for vehicle carriers.
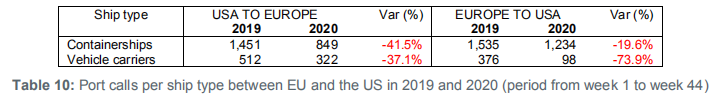
5.4 Trade between US and Europe by ship type
The most relevant ship types engaged in trade between Europe and the US are container ships and vehicle carriers. Contrary to the trade with China, for containerships, the impact is higher on incoming voyages from the US and lower on outgoing voyages from Europe to the US.
Table 10 shows that the number of port calls by container ships dropped 41.5% from United States to Europe and only 19.6% from Europe to the US. Even though less significant in terms of volume of port calls, Vehicle carriers are the ship type showing the highest reduction in the number of port calls from Europe to the United States (73.9%). In the opposite direction the reduction is of 37.1%.
In order to better analyze the time trend of the traffic between EU and these two important destinations for the shipping transport, see below the graphs representing the evolution of such traffic (measured in terms of ‘‘number of port calls”) over the past 6 months. In order to use data as much stable as possible, the number of port calls for the current week (week 44) is not included in this monthly analysis (sequences of 4-weeks periods) as EMSA often receives updates from data provider only in the following week and that may change significantly the numbers. Therefore, the data represented below covers the months from May to October approximately (week 19 to week 42).
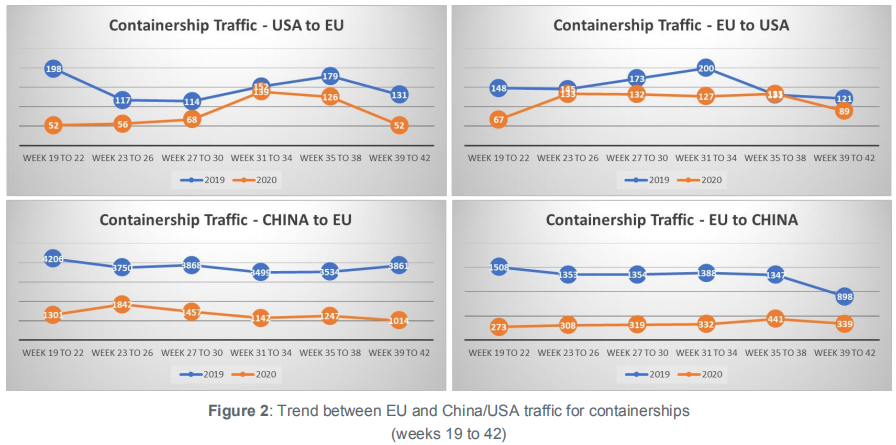
For the containership sector, the traffic with the United States after having almost stabilized (reaching values closer to the observed values in 2019), dropped again in the last 4 weeks analysed (i.e. weeks 39 to 42).
The traffic between EU and China is taking longer to uptake to the values observed in 2019. To note that the variations seen in 2020 are in general aligned with similar variations happening in 2019, therefore not COVID-19 related.
6. Impact on cruise ships and other passenger ships
The COVID-19 outbreak created a high degree of public concern about the approach to health and safety on board cruise ships. Large numbers of people in confined spaces on cruise ships can make both passengers and crew prone to infectious diseases, and in this case, the coronavirus.
Cruise ships and passenger ships are the 2 ship types mostly affected by COVID-19. Every major cruise line in the world suspended departures in March as the coronavirus outbreak grew.
Some cruise operators decided in August to gradually return to service at reduced capacity. In most cases, these are single-nationality cruises calling in at a limited number of ports, usually in the country of origin. Nearly all are in Europe or Asia, as major USA cruise lines are on an operational pause until at least 31 December 2020, bound by the Cruise Lines International Association (CLIA) decision.
This section presents more detailed statistics on cruise and other passenger ships.
6.1 Cruise ship calls
In March, EMSA started its analysis of cruise ship related data that is available via the information systems hosted by the Agency, and also from other sources. EMSA produced a status report with: a list of cruise ships located at EU ports (moored or at anchor); a list of sailing cruises having declared an EU port as the destination in the coming days, and; associated maps showing the positions of the vessels (moored and sailing).
The information on cruise ship positions was taken from AIS data available in the EMSA systems. To identify the cruise ships moored at ports, the criterion used was the speed recorded in the AIS (i.e. when the speed is over 1 knot, the vessels is considered to be moving). When a cruise ship arrives at a port or anchorage, the speed goes below 1 knot. AIS information was also used to identify the destination port.
EMSA produced a report with the list of “cruises sailing to EU ports” and an associated map showing the current positions and destination ports/areas. The locations of the cruise ships correspond to the time of drafting the report. The reports are produced daily and shared with the Commission, EU Member States and EFTA countries.
Figure 3 shows the evolution in the number of cruise ships moored/at anchor and sailing in and around EU ports since 1 April 2020:
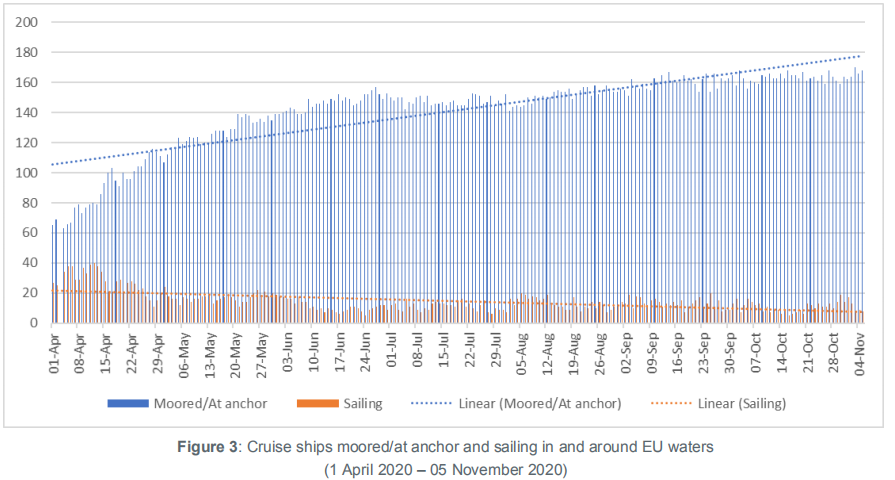
The figures show a growing number of cruise ships bound for EU ports and staying at ports or anchorages. The destinations are mainly ports in the Canary Islands, Germany, the Mediterranean, Portugal and the UK.
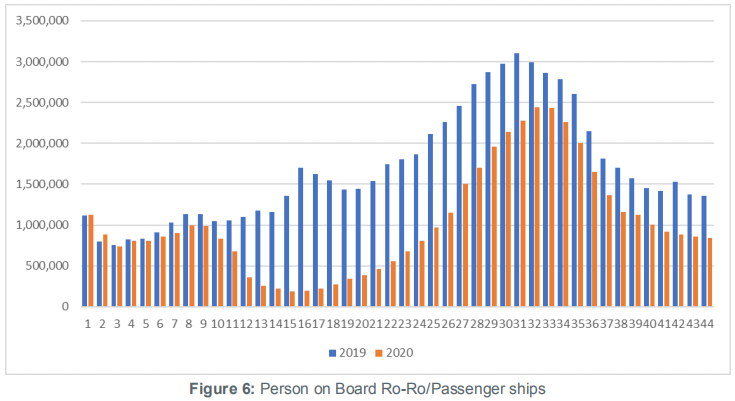
6.2 Total number of Persons on Board (PoB) for cruise ships and other passenger ships
Using Persons on Board (PoB) information reported to SSN5 , EMSA analysed the changes in the PoB numbers for different ship types.
For cruise ships and other passenger ships, there is a significant decrease in the number of Persons on Board (as shown in Figures 4, 5 and 6). The figures show the PoB per week during 2019 (in blue) and 2020 (in orange).

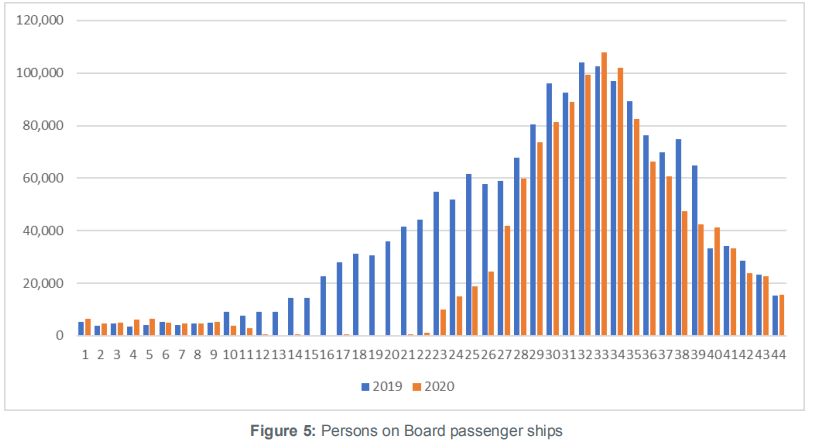
Cruise ship operators almost lost their businesses during the Covid-19 pandemic. The Figure 4 clearly demonstrates that the number of PoB began to decrease gradually from the beginning of March (around week 10). Currently, the numbers remain at a very low level and correspond to crew members on board these ships.
An increase in the number of PoB on board of Passenger ships and Ro-Ro/ Passenger ships can be observed.
There are no changes to the number of Persons on Board for cargo ships (bulk carriers, oil tankers, container ships, etc.), as safe manning needs to be ensured.
7. Impact on vessel movement patterns
The use of Traffic Density Maps (TDM) is a simple and effective way to show vessel movement patterns. The TDMs are produced by compiling ship’s positioning data and can highlight congested areas.
The figures below show traffic density map for all ships, tankers, cargo vessels, and passenger ships in European waters in October 2019 and October 2020. The main conclusion is that traffic in and around EU waters was not heavily affected apart from passengers’ ships.
8. Congestion at anchorages in EU waters
The maritime sector faces the prospect of an unprecedented number of vessels at anchor. Figure 11 shows the number of AIS reports (T-AIS is reported every 6 minutes for each vessel under the coverage of AIS coastal station) with navigational status “at anchor” in the first 44 weeks of 2019 (blue color) and 2020 (orange color):
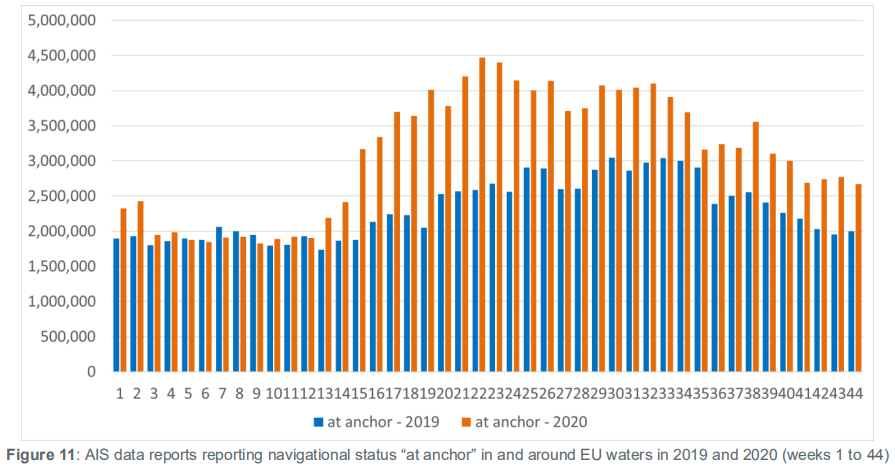
The graph shows that, from week 13, there is an increase of number of AIS reports indicating navigational status “at anchor” in comparison with 2019.
RECOMMENDATION

 Hotline
 Email
Email

 沪公网安备 31011502016705号
Disclaimer:
This communication has been prepared for general information only. To the maximum extent permitted by law, E-PORTS and its affiliated companies, its and their employees, directors, agents, contractors (of any tier) and partners shall not be liable for any loss, claim, charge, damage, liability or damages howsoever arising in connection with the information even if advised of the possibility of damages. The use of the information shall be at your sole risk. Information contained herein comes with no representation or warranty (express or implied) and specifically is not represented or warranted to be correct, complete, accurate or up to date. The information is provided on an “as is” and “as available” basis and is not intended to be relied upon in any way. You shall be solely responsible for the selection, use, efficiency and suitability of the information.


 Chat with us