
Port Performance Freight Statistics in 2018 Annual Report to Congress 2019
Port Performance Freight
Statistics in 2018
Annual Report to Congress 2019
Introduction
The Marine Transportation System (MTS) consists of waterways, ports, terminals, and intermodal landside connections that allow the movement of people and goods to, from, and on the water. As part of the MTS, the Nation’s ports provide critical connections between waterways, highways, pipelines, and railroads.
Water is the leading transportation mode for international freight transported to and from the United States. Vessels moved 41.9 percent of the value and 70.7 percent of the weight of U.S. international trade in 2018. Of the top 25 U.S. international freight gateways (airports, land border crossings, and maritime ports) by value, 10 are maritime ports.
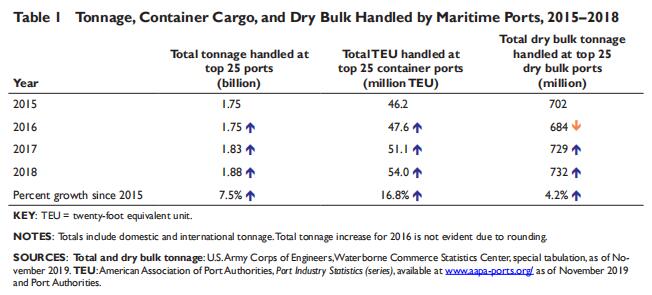
Table 1 shows the overall growth in cargo handled by the top 25 maritime ports. Growth in freight movement is supported by increased port capacity from expanded marine terminals at ports across the country. These data illustrate the type of information needed to monitor the performance of our Nation’s ports—performance that is critical to the U.S. economy.
Program Background
The Fixing America’s Surface Transportation (FAST) Act established the Port Performance Freight Statistics Program (PPFSP) in the Bureau of Transportation Statistics (BTS) of the U.S. Department of Transportation (USDOT). The FAST Act requires an annual report to Congress that includes statistics on capacity and throughput for selected maritime ports. This annual report builds on previous editions and provides new data and performance metrics.
The PPFSP covers all five major categories of waterborne cargo: containerized, dry bulk, liquid bulk, break bulk, and roll-on/ roll-off (Ro/Ro). Commodities transported in maritime commerce vary greatly, affecting the types of vessels, ports, and terminals used. For example, one terminal may be equipped with elevators to load and unload dry bulk commodities, such as coal and grains, while another uses ship-to-shore gantry cranes to load and unload containers.
The statistics in this report measure total port capacity and throughput for the top ports in 2018. The report also shows changes in throughput from previous years to illustrate the extent of changes in cargo handled. BTS used the following criteria to select throughput and capacity measures for this report:
Data availability—The chosen measures must be readily available for at least the top 25 ports to which they apply (e.g., tonnage, vessel calls and sizes for all ports, TEU for container ports).
National consistency—Measures must be based on a nationally consistent definition and collection methodology. Ideally, the measure should be available from a single, authoritative source. If not, BTS reconciled multiple sources to ensure consistency.
Timeliness—The most recent information is sought, with a goal of data no more than 2 years old for key measures.
Relevance and clarity—Measures should be closely connected to the throughput and capacity of ports, terminals, and port infrastructure and be understandable to readers unfamiliar with ports or shipping terminology.
Accuracy and transparency—Measures should be accurate within defined data quality standards and should come from authoritative sources, as outlined in the technical documentation found on the BTS website.
Online Port Profiles
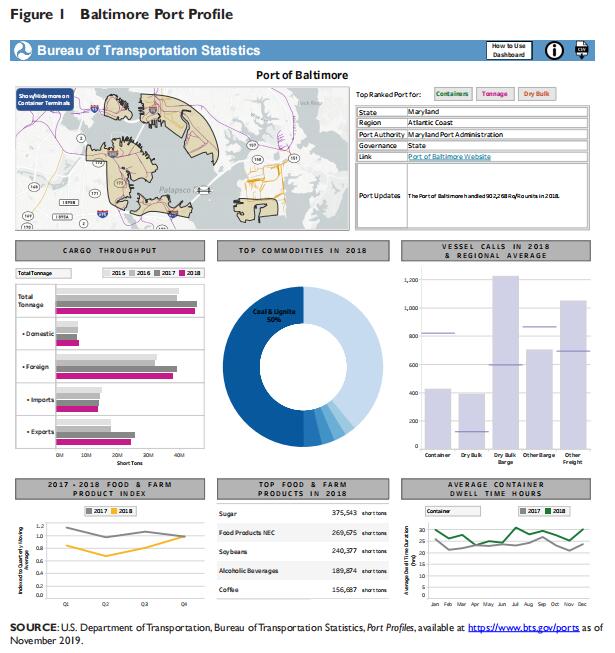
New to the program this year is a complete set of interactive online Port Profiles that provide capacity and throughput data. In addition, the online Port Profiles include port characteristics, such as vessel calls by type; terminal dwell times for container, tanker, and roll-on/roll-off (Ro/Ro) vessels; contextual information; and updates specific to each port. Figure 1 shows an example of an individual Port Profile (Baltimore) available on the BTS website at www.bts.gov/ports.
Top 25 Ports in 2018
The FAST Act requires the Port Performance Freight Statistics Program to identify the top 25 ports for each of these measures:
1. overall cargo tonnage,
2. 20-foot equivalent unit (TEU) of container cargo, and
3. dry bulk cargo tonnage.
Table 2 lists the top 25 ports for each category (tonnage, container, and dry bulk) in 2018, a total of 49 ports. Many ports are included in more than one category. For example, there are 7 ports that appear in all 3 of the top 25 lists:
• Baltimore,
• Houston,
• Long Beach,
• Mobile,
• New Orleans,
• New York and New Jersey, and
• Virginia.
Forty-six of the ports are located within the contiguous United States, plus 1 in Alaska, 1 in Hawaii, and 1 in Puerto Rico. The top 25 ports within each of these 3 categories have remained relatively consistent across the last 2 years.
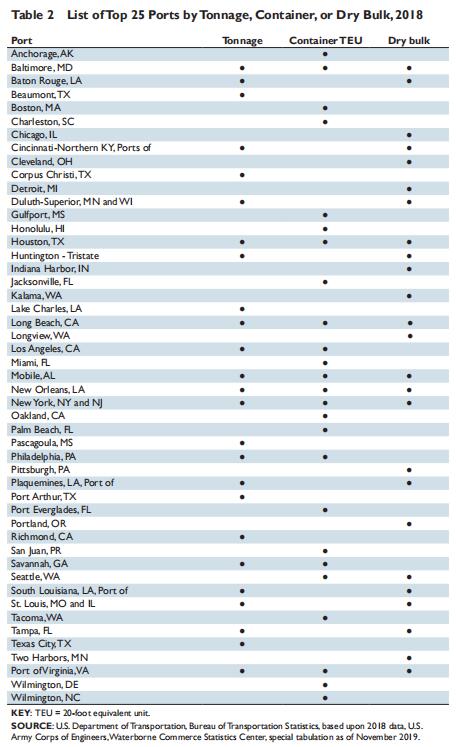
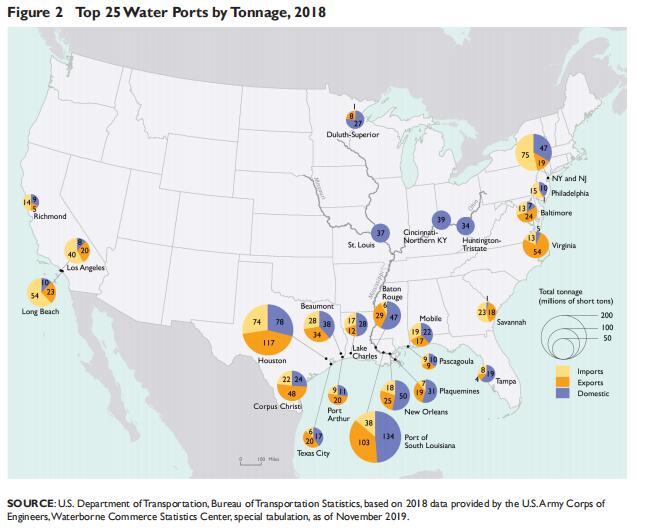
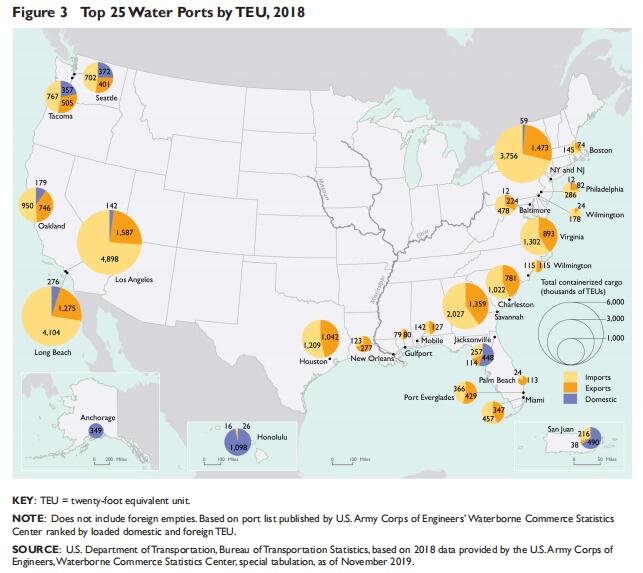
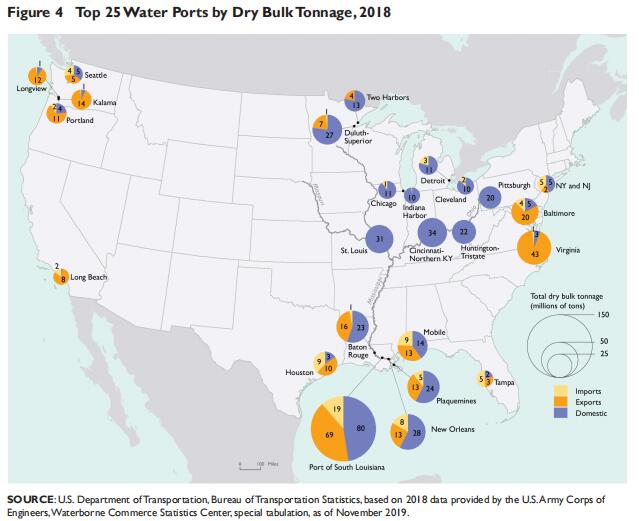
The 2018 list of 49 ports remains nearly the same to that of 2017 with only one difference—in 2018, Pascagoula, MS, replaced Valdez, AK, as one of the top 25 ports by tonnage. Performance statistics for each port listed in table 2 are provided in the online Port Profiles available at https://www. bts.gov/ports. The geographic distribution of profiled ports varies by the type of freight handled. For example, most of the dry bulk ports are located along the Great Lakes and lower Mississippi. While the container ports are mostly located along the Atlantic, Gulf, and Pacific coasts. The volume of imports, exports, and domestic freight handled by each of the top 25 ports by tonnage, TEU, and dry bulk tonnage are depicted, respectively, in figures 2, 3, and 4.
Port Throughput Metrics
Port throughput can be measured from different perspectives. For example, throughput could be measured by the amount of cargo or the number of vessels that a port handles over time. Port throughput is affected by many variables beyond its physical capacity, such as the volume of international or domestic cargo, competition between ports, contractual arrangements with shipping lines, disruptions caused by extreme weather (e.g., hurricanes), and connections to inland origins and destinations. Most coastal ports handle both domestic and international cargo carried on oceangoing vessels, while inland ports (e.g., the ports of St. Louis, Cincinnati, Huntington, and Pittsburgh) almost exclusively handle domestic cargo moved on barges.
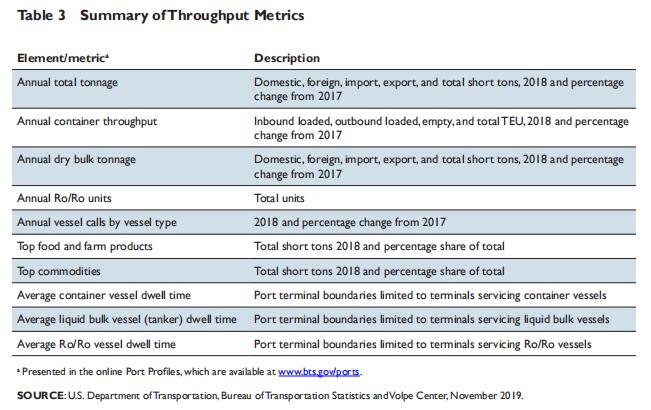
The throughput measures included in this program are summarized in table 3. Vessel dwell times are shown monthly, the food and farm products indices are shown quarterly, and all other throughput measures are annual. Annual data may mask seasonal variations in cargo flows that place periodic stress on available port capacity.
Tonnage
The domestic and foreign short tons handled by the 25 top tonnage ports in 2018 are shown in figure 5. The highest tonnage figures are associated with ports that handle large quantities of both liquid bulk cargo (e.g., petroleum or chemicals) and dry bulk cargo (e.g., coal or grain), such as the ports of Houston and South Louisiana.
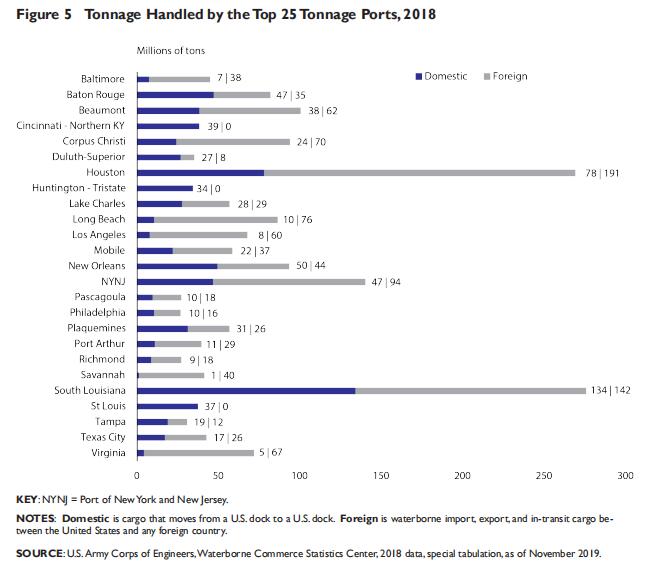
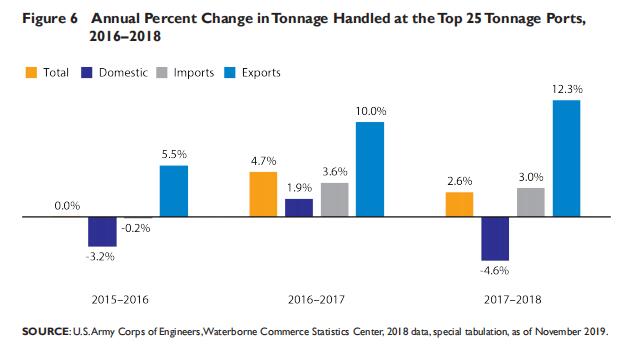
Foreign cargo handled by the top 25 tonnage ports has increased its share of the total in each of the past 3 years, growing from 54.8 percent in 2015 to 60.5 percent in 2018. The shift is due largely to a high growth rate in export tonnage. Figure 6 shows that, year over year, export tonnage grew 5.5, 10.0, and 12.3 percent, respectively, between 2016 and 2018. Conversely, domestic tonnage declined 4.6 percent between 2017 and 2018. Widespread flooding and droughts present navigational hazards and lock closures along the Mississippi River and its tributaries, which in turn can cause fluctuations in the tonnage moved domestically. For example, the Mississippi River was at flood stage at Baton Rouge for 67 days during 2018 (6th longest since 1927).
Container / TEU
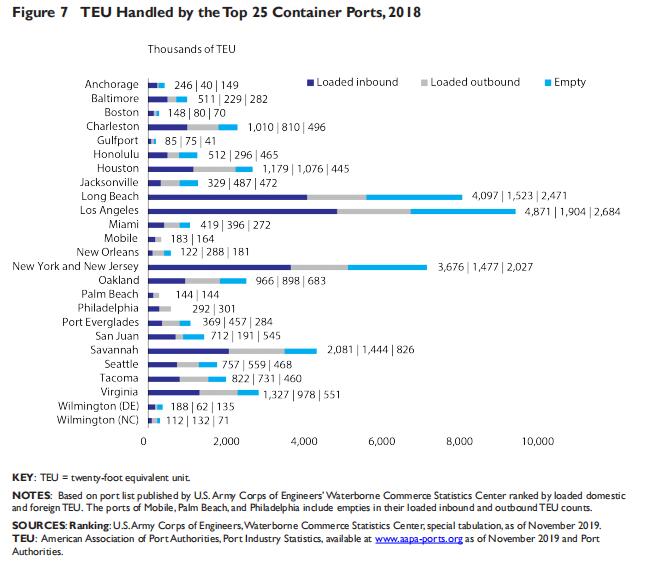
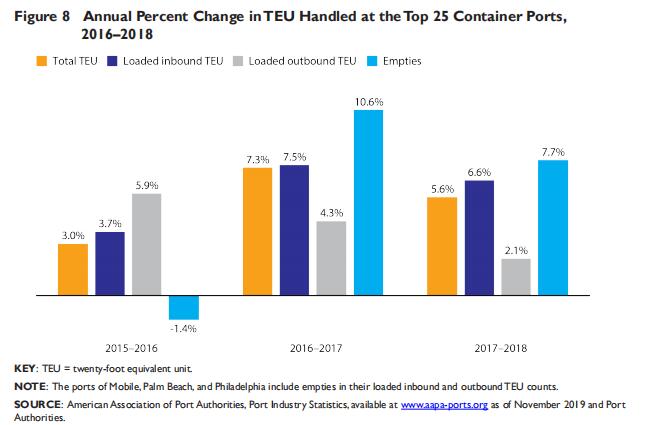
Figure 7 displays the total number of TEU handled by the top 25 U.S. container ports in 2018. The highest TEU volumes are associated with coastal container ports, such as the ports of Long Beach, Los Angeles, and New York and New Jersey. In 2018 these ports also handled about 2.5 million, 2.7 million, and 2.0 million empty TEU, respectively, that contributed to the effort required to load and unload each container vessel. The 2018 list of top 25 container ports by TEU is unchanged from the 2017 list. Figure 8 shows that, year over year, total TEU grew 3.0, 7.3, and 5.6 percent between 2016 and 2018, mostly from inbound cargo.
Dry Bulk
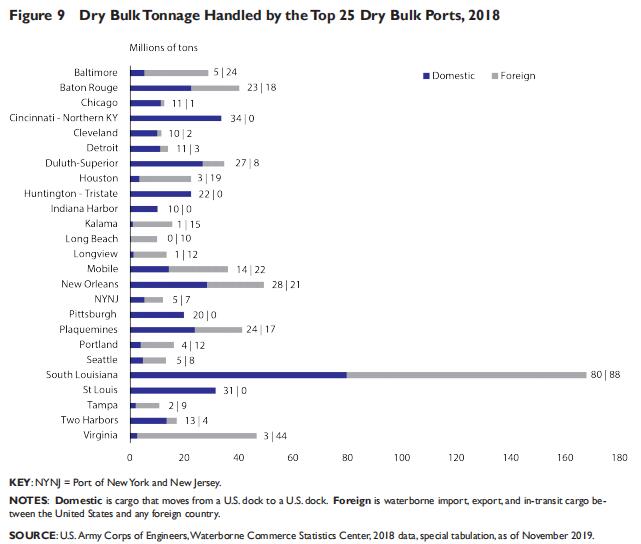
The top 25 ports by dry bulk tonnage (e.g., coal, grain, iron ore) remained relatively consistent between 2017 and 2018. South Louisiana handled by far the greatest volume of dry bulk cargo in 2018 (figure 9), almost four times the amount handled by the number 2 and number 3 ports of New Orleans and Virginia. South Louisiana is a major export hub not only for dry bulk cargo, but for liquid bulk cargo as well (e.g., petroleum and chemicals).
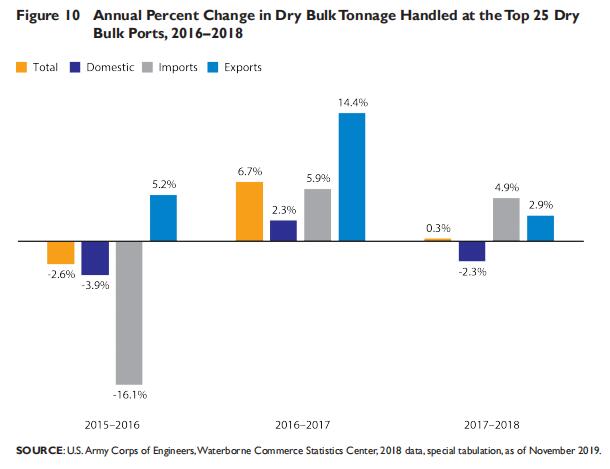
Figure 10 shows that dry bulk tonnage handled at the top 25 dry bulk tonnage ports grew 6.7 and 0.3 percent, respectively, in 2017 and 2018.
Vessel Dwell Times
The time vessels spend in a port is a major factor contributing to cargo throughput and performance. BTS calculates dwell time estimates for container, liquid bulk (tanker), and Ro/Ro vessels using U.S. Coast Guard Automatic Identification System (AIS) data. AIS is a ship-to-ship and ship-to-shore maritime navigation safety communications system that monitors and tracks ship movements primarily for collision avoidance.
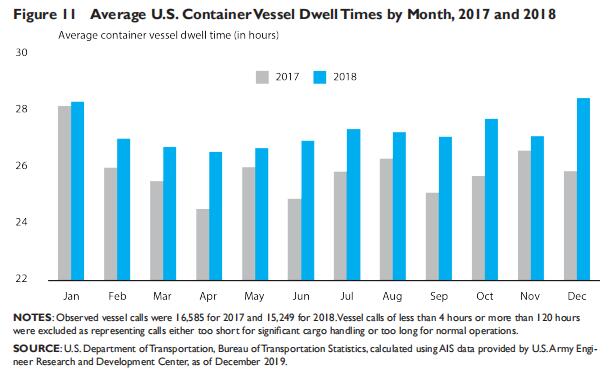
The average 2018 dwell time of container vessels at the top 25 U.S. container ports was 27.3 hours, up from 25.9 hours in 2017. As figure 11 shows, the month-to-month U.S. average dwell time tends to vary within a 1- to 2-hour range, although vessels often dwell longer in a port during winter months, particularly in December and January since ice and snow slows port operations. Note that the United States average dwell time for container vessels was 28.5 hours in December 2018. Record precipitation affecting a large portion of the eastern two-thirds of the United States may have contributed to an increase in the annual U.S. average dwell times in 2018.6 Average container vessel dwell times for individual ports are shown in the online Port Profiles, which are available at www.bts. gov/ports.
Port Capacity Metrics
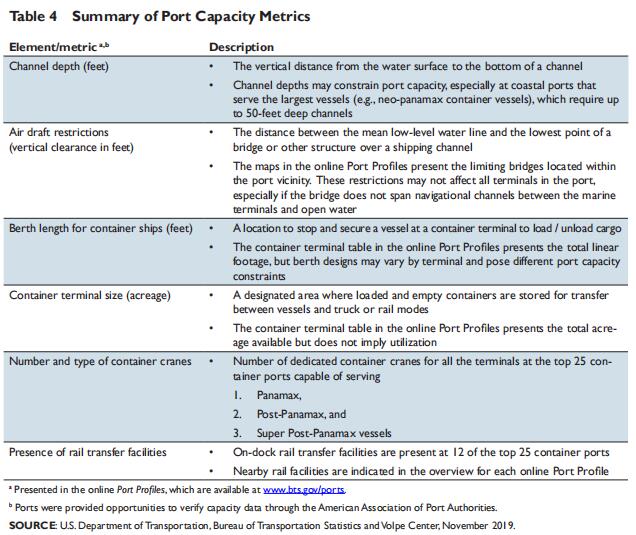
Many factors influence port capacity, which is a measure of the maximum throughput that a port and its terminals can handle over a given period, in tons, twenty-foot equivalent unit (TEU), or other units, such as barrels of liquid bulk (e.g., crude petroleum) or number of vehicles handled. Maximum throughput can be set by physical constraints, including the physical size (acreage) of terminals, length of berths, depth of access channels, and the amount and type of cargo handling equipment (e.g., container cranes). Port capacity can also be influenced by operational factors not currently measured in this program (e.g., gate hours) and economic factors, including labor availability and cost. These factors are typically proprietary, making them less likely to be nationally consistent or available for public use. Port features that influence capacity are summarized in table 4.
Air Draft and Channel Depths
Air draft and channel depths have increasingly limited port capacity as larger vessels have been put into service. These restrictions may not affect all terminals in a port. For example, some ports might have terminals with no air draft restrictions (e.g., container terminals at the Port of Virginia) because no bridges cross their navigation channels.
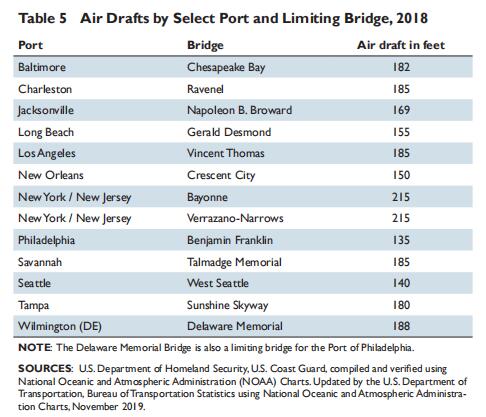
Table 5 shows the air drafts for select ports with limiting bridges, and the online Port Profiles show what, if any, air draft restrictions exist within the port vicinity. Air draft restrictions may be eliminated as bridges are either raised or replaced. For example, the Bayonne Bridge in the Port of New York and New Jersey’s vicinity had an air draft that varied with the tide between 151 and 156 feet over the Kill Van Kull River, but the bridge was recently raised to 215 feet to allow larger vessels to pass safely beneath its span. The Gerald Desmond Bridge in the Port of Long Beach’s vicinity is being replaced with a new span that will raise the air draft over the Back Channel from 155 to 205 feet.
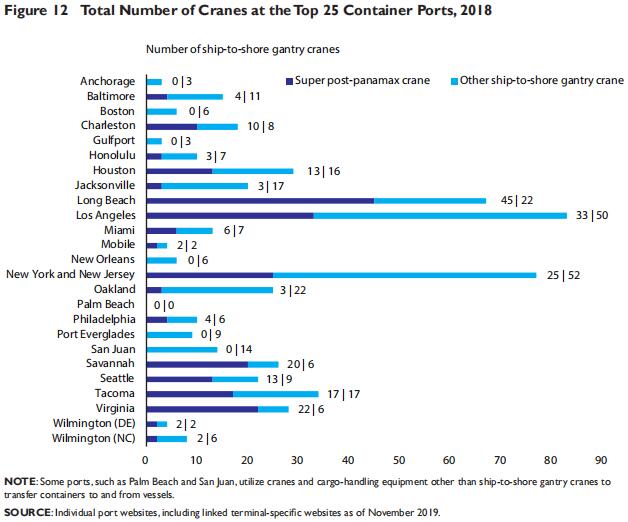
Container Cranes
The number and size of cranes affects the number and size of container vessels a terminal can service simultaneously. The top 25 container ports operated a total of 534 ship-to-shore gantry cranes7 in 2018; 227 of these were classified as super post-panamax.8 Figure 12 shows the number of shore-side container cranes used to load and unload container vessels. Container cranes are the link between the waterside and landside, including truck and rail connections, or the container yard used for short-term storage.
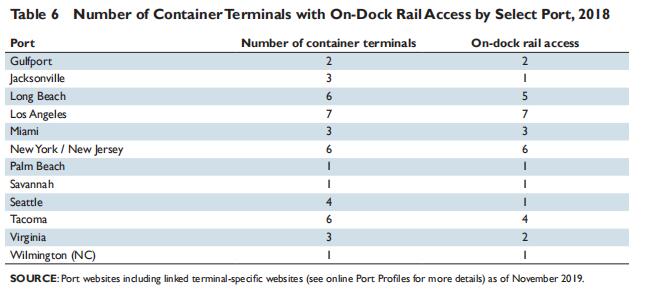
Rail Connections
All major ports are either directly connected to the rail system or have nearby rail facilities. Bulk terminals have a variety of rail service connections suited to the type and volume of commodities they handle. Most container terminals have either on-dock transfer facilities within the terminal boundaries or off-dock facilities nearby. The online Port Profiles provides an overview of port rail connections. Table 6 lists 12 container ports with on-dock rail. A total of 35 out of the 43 container terminals at these ports had on-dock rail access in 2018.
Conclusion
The Port Performance Freight Statistics Program serves a variety of stakeholders with diverse information needs and concerns, from U.S. Department of Transportation policy officials and members of Congress, to the many groups involved in port management and operations, the shipping community, and the public. This fourth Annual Report and corresponding interactive digital Port Profiles on the BTS website reflect an ongoing evolution of the Port Performance Freight Statistics Program to meet the needs of our stakeholders.
BTS continues to review stakeholder comments and explore alternative data sources to expand port throughput and capacity statistics. Please send questions and comments on the Port Performance Freight Statistics Program and the Port Profiles to PortStatistics@dot.gov.
RECOMMENDATION

 Hotline
 Email
Email

 沪公网安备 31011502016705号
Disclaimer:
This communication has been prepared for general information only. To the maximum extent permitted by law, E-PORTS and its affiliated companies, its and their employees, directors, agents, contractors (of any tier) and partners shall not be liable for any loss, claim, charge, damage, liability or damages howsoever arising in connection with the information even if advised of the possibility of damages. The use of the information shall be at your sole risk. Information contained herein comes with no representation or warranty (express or implied) and specifically is not represented or warranted to be correct, complete, accurate or up to date. The information is provided on an “as is” and “as available” basis and is not intended to be relied upon in any way. You shall be solely responsible for the selection, use, efficiency and suitability of the information.


 Chat with us