
The Role of Port Development Companies in Transitioning the Port Business Ecosystem
The Role of Port Development Companies in Transitioning the Port Business Ecosystem; The Case of Port of Amsterdam’s Circular Activities
1. Introduction
There is a clear transition towards a circular economy (CE), a gradual and incremental process of structural societal change where materials and components are increasingly reused or recycled at the end of their lifecycle (EOL). This transition, which may, on the one hand, be understood as a subcategory of a more general sustainability transition and on the other be seen as a development that pushes the frontier of sustainability , has important consequences for supply chains, ranging from the way products are designed to the business models of companies . The trend towards circular supply chains is partly driven by profit potential for companies and partly by societal pressure to increase the sustainability of the local or national economy, which leads to policies to promote sustainability and ‘green purchasing’ of consumers and companies. Recycling is already advanced for materials such as glass, steel and paper, while for others, such as construction and demolition waste, considerable efforts are made to increase recycling rates . However, recycling of food waste, e-waste, tires and textiles is still limited. The volumes of waste that are still generated at the product EOL represent an enormous loss of material and energy resources. Thus, an increasing number of companies focus on creating value through advancing the circularity of supply chains.
Ports as transport nodes and as locations for logistics and manufacturing activities will be affected by the transition towards CE. Ports handle huge volumes of non-renewable primary resources. The trend towards CE will likely lead to a decline in these volumes . The majority of non-fossil imports and exports furthermore consist of products in linear supply chains, and these flows will be impacted as well, especially when supply chains move from current globalized and linear structures to more localized and circular ones. The CE transition also offers an opportunity for ports to diversify into circular economy activities as alternative lines of business .
In most ports, an autonomous but government-owned port development company (PDC) is responsible for port development . While such a publicly owned company operates commercially, it is generally not oriented towards maximizing profit but towards creating value for society . Thus, on top of the commercial logic of attracting CE as it provides growth opportunities, government ownership of a PDC may increase the focus on attracting sustainable activities to the port complex, especially given the fact that ports are under pressure from stakeholders to mitigate the social, economic and ecological harms caused by the commercial, tourist and industrial activities localized in the port .
Notwithstanding the advances in the understanding of the role and business model of the PDC , the role of the PDC in transitioning the port towards a circular model has not received detailed attention. This paper is to our knowledge the first paper which deals with the implications of CE for the business model of the port development company.
We first provide a cursory overview of new investments in circular manufacturing activities in European ports based on primary data collected from their organizational reports and official webpages. This allows us to map the transition towards CE and show the relevance for ports.
Second, we provide a framework for analyzing the role of the port development company in transitioning the port business ecosystem, based on a review of the relevant literature. We then provide an in-depth analysis of the role of Port of Amsterdam (PoA) in developing circular activities. The case of Amsterdam is particularly interesting as it is clearly a frontrunner in the CE transition in ports and has the highest number of CE activities of all European ports. We describe the emerging CE activities in detail and assess the changing role of PoA. We finalize the paper with a concluding section.
2. CE Activities in European Ports
We first explore CE activities in the entire population of European Core and Comprehensive ports, as listed by the EU Commission, except the ports in the United Kingdom (UK). UK ports are excluded as they are developed mainly by private companies, which each operate a group of ports and, to the best of our knowledge, report very limited data on specific ports. We rely on primary data from the port’s organizational reports and official webpages. Organizational reports are generally accepted for studying the interaction of organizations with their environments , and port authorities are usually keen to reveal their environmental measures , thus reflecting the tendency of environmentally high-performing organizations to disclose environmental management information . In sustainability reports, the relevant information is stated clearly and is generally easy to find. However, only some ports provide such reports, of which several are accessible only in the official languages in the respective countries. We supplement this with information from annual reports, although here, CE information tends to be veiled within broader financial and strategic statements. Finally, we analyze CE statements contained in mission and strategy descriptions disclosed through the ports’ webpages. A drawback is that such information may differ greatly among the ports. For example, an earlier study found great variation in the extent and content of corporate social responsibility (CSR) reporting on the webpages of 186 European ports . Finally, some ports do not have an official webpage and others provide incomplete information. We specifically assess new investments in CE activities in the period 2010–2017, as these are most likely to be reported in annual reports, news items or other publications. The data collection was executed from May 2018 to March 2019.
Our assessment covers a total of 280 European ports. Broadly in line with , we include the generation of renewable energy (mainly wind, solar and biomass) in ports as a circular activity, as well as activities in collecting and processing materials at the end of a lifecycle (i.e., materials that have previously been used) for a form of reuse. This material may be conventionally treated as waste, (i.e., burned/landfilled), but may also already often be recycled (e.g., scrap). We include activities that mainly use agricultural by-products for other purposes than food/feed. Food/feed processing is excluded because it has always relied on agricultural products. Thus, the use of agricultural products cannot be considered an alternative for using scarce natural resources. As an example, we consider using biomass for making plastics as circular, while we do not regard a flour mill as circular.
We acknowledge the shortcomings of these population-level data. The detailed analysis of the case of Amsterdam presented in this paper allows for a check on the composed population data. While for Amsterdam, the actual number of new CE establishments in the period 2010–2017 was 11, our broad-based assessment of publicly available sources revealed eight of these (around 73%). Thus, while our quantifiable population data are incomplete, they suffice to draw out the bigger picture of the transition towards CE among European ports. Hence, the data are only used to provide a global picture of CE activities in European ports. Tables 1 and 2 show the results.
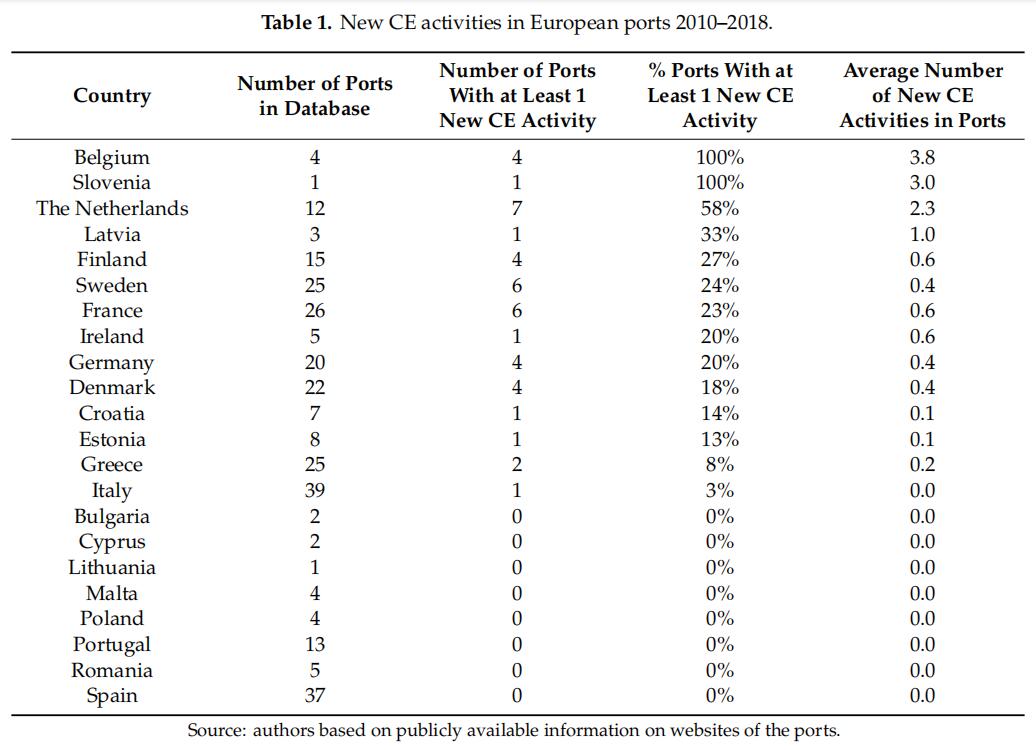
Our observations on the broad population of European Core and Comprehensive ports allow us to state the following conclusions. First, in about one out of three European ports, at least one activity can be classified as circular. Second, there is a clear concentration of CE activities in the ports in West Europe, especially in Belgium and The Netherlands, and to a lesser extent, North Europe (Scandinavia and the Baltic States). Virtually no CE activities were identified in East and South Europe. This is partly due to the fact that ports in The Netherlands and in Belgium are also industrial complexes. In some other countries, industrial activities are not formally (or functionally) part of the port complex; as one example, the Port of Sines (Portugal) only encompasses the terminal and logistics activities, whereas the industrial park is located outside of the port area. In addition, the central locations of Dutch and Belgian ports in Europe make them attractive as hubs for waste collection and processing.
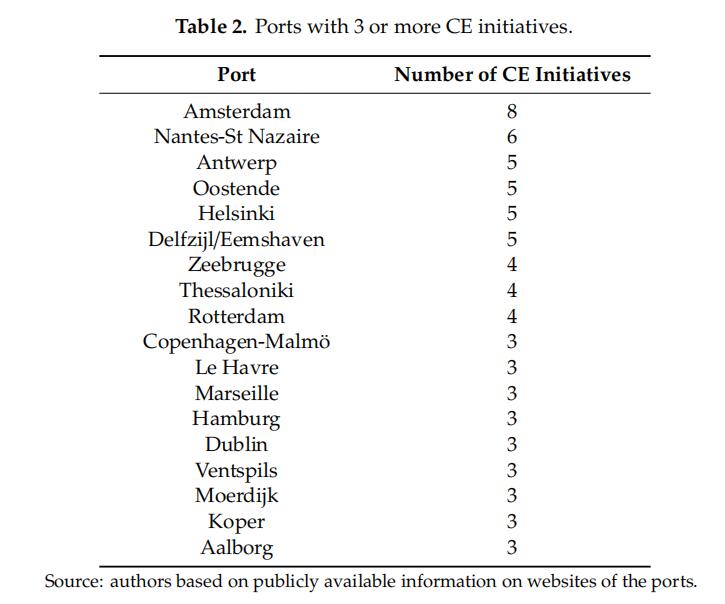
Third, investments in CE are only loosely related to cargo volumes. The three largest European ports in volume terms (Rotterdam, Antwerp and Hamburg) have CE activities, but ports with relatively small volumes, like Oostende and Groningen Seaports also have managed to develop a leading role in CE activities. Given the demonstrated development of circular activities in ports and the expectation that ports will attract more CE activities as the transition towards CE advances, it is relevant to assess if and how the circularity trend affects the role and business model of the port development company.
3. The Port as a Business Ecosystem and the Role of the PDC in Transitioning This Ecosystem; A Review
In most ports, an autonomous but government-owned PDC aimed at financial sustainability and creating broader societal value is responsible for port development. The central concept in assessing the role and business model of the port development company is the concept of the port as a ‘business ecosystem’ . This aligns well with various studies that also analyze circular economic activities with a business ecosystem perspective .
In management studies, the ecosystem metaphor is often utilized without a clear definition, and several partially overlapping concepts such as industrial, business and innovation ecosystems have been introduced . In the broadest definition, an ecosystem refers to a group of interacting firms that depend on each other’s activities. More precise definitions have been proposed, partially with the aim to distinguish ecosystems from related concepts such as networks and hierarchical, vertically integrated firms. In such definitions, the focus is on the complementarity of products for users. Cennamo et al. define ecosystems as ‘a set of actors with varying degrees of multi-lateral, non-generic complementarities that are not fully hierarchically controlled’. It is the non-generic nature of complementarities, which necessitates some degree of customization, that generates the uniqueness of an ecosystem.
In this approach, so-called ’complementors’ (i.e., firms that offer complementary products) make their own decisions (e.g., in terms of design choices or price setting), while still forming part of an interdependent product or service. In this definition, ecosystems differ from integrated supply chains through more limited hierarchical control, while they differ from networks in the sense that ecosystem members may simply adhere to standards or common infrastructure without having developed network ties. There is competition between ecosystems (i.e., all members benefit from the success of the ecosystem as a whole). Firms in an ecosystem can be direct competitors, and in addition compete for capturing a share of the profits generated in the ecosystem.
Management research on ecosystems focuses largely on the analysis of digital ecosystems and consequently has so far not addressed cases where complementarities are derived from co-location in space. Ports (as well as airports ) can be considered as ecosystems in which different types of users benefit from complementarities and shared infrastructures . For instance, shipping lines purchase various complementary services in a port, such as cargo handling, bunkering, towage, waste collection, inland transport and others. These are non-generic in the sense that they become more attractive if the firms in the ecosystem coordinate their activities. Likewise, shippers also purchase various complementary services in a port, ranging from warehousing to inland distribution. The same applies for manufacturing firms that purchase transport, storage, energy and related services. For such companies, purchasing some services within the spatially delimited ecosystem is more valuable than purchasing them from outside of the ecosystem.
3.1. The Port Business Ecosystem and the PDC
The emerging concept of a ‘port business ecosystem’ considers ports as localized business networks in which individual companies strongly depend on the development of the ecosystem as a whole. The business ecosystem perspective provides relevant insights for the role and business model of the port development company (PDC). The literature on business ecosystems distinguishes between different stylized roles in the ecosystem; the main distinction is between that of niche players (or complementors) and the focal firm—also known as a hub firm or an architect —that leads the development of the ecosystem. Helfat and Raubitschek have recently argued that innovation capabilities and integrative capabilities are critical for ecosystem developers.
Iansiti and Levien, while not confining their focus to geographically bounded systems (such as ports or airports), distinguish three potential strategies for an ecosystem developer: distinguish three potential strategies for an ecosystem developer: a landlord strategy, a dominator strategy and a keystone strategy. They argue that for key actors, who possess crucial assets in the ecosystem and depend strongly on the prospering of the ecosystem as a whole, a keystone strategy generally is most suitable for the long-run development of the ecosystem. Keystones play a more active role in shaping the ecosystem than landlords, which are more passive. Compared to dominators, keystones are more oriented on creating value for and capturing value from third parties in the ecosystem. Keystones aim at providing a proper level of diversity within the ecosystem (which sometimes means removing parts of the system that do not contribute to raising system level productivity) and create platforms (services, tools, or technologies) that allow other ecosystem members to be successful. Such a strategy has proven extremely successful for companies such as Wal-Mart in the retail industry and Microsoft Corporation in the computing business ecosystem.
3.2. The Strategy and Business Model of the PDC
The keystone strategy advocated by Iansiti and Levien is in line with the strategies developed by many port development companies. PDCs increasingly operate with a landlord business model, i.e., they attract third parties to their ecosystem. Port reform in various countries has led to a shift from ’operating ports’, in which the PDC provides port operations in-house (a dominator strategy, in the vocabulary of Iansiti and Levien). Most PDCs remain state-owned.
By operating a land lease model, the PDC leaves a substantial part of the port operations in the ecosystem to third parties and focuses on improving the quality of the port as a platform. On the other hand, many of those PDCs that traditionally operated as landlords have shifted away from a passive role, in which they focused mainly on the provision of port infrastructure such as quays and basins (the passive landlord strategy in the terms of Iansiti and Levien). Increasingly, PDCs develop a more active role, which is described with different labels such as cluster manager, orchestrator or matchmaker, and is in line with the keystone strategy. In this strategy, PDCs develop services and tools to make the port as a whole more productive and competitive.
Ports are special compared to other (digital) ecosystems in the sense that the ecosystem developer is often state-owned. In line with the developing body of knowledge on SOEs, a state-owned PDC is expected to behave differently from a private PDC. Two differences are relevant in the context of the keystone strategy. First, the state-owned PDC is expected to have a higher commitment than a private PDC to investments in the ecosystem with benefits that are partly external to the PDC (i.e., cannot be fully captured by the PDC). Second, the state-owned PDC is expected to have a higher commitment to reducing negative externalities and creating positive externalities (especially in R&D and training and education) than a private PDC. The state ownership is relevant for the firms in the port business ecosystem as risks of niche firms in ecosystems are partly related to exogenous developments but also partly to the actions of the core firm in the ecosystem. These theoretical considerations are taken into account in the questions addressed in the case of Amsterdam, which are detailed in the next paragraph.
4. The Transition Towards CE; the Case of Port of Amsterdam
4.1. Research Questions and Methods
This paper applies a case study strategy to the study of the role of PDCs in port business ecosystem transitions. Following, we see the case study as a research strategy that employs a variety of data sources to examine a particular phenomenon in its natural context and in this process relate theories and concepts with practice. Following, we furthermore understand case studies as the thorough study of a single unit for the purpose of understanding a larger class of similar units. The particular phenomenon that we investigate is the role of PDCs in port ecosystem transition, as exemplified by the transition to CE, and the formal unit chosen for intensive investigation is the Port of Amsterdam (PoA).
In line with the emerging stream of research on PDCs as developers of the port business ecosystem, described above, and the focus of this paper on CE activities, four broad questions are addressed. First, there is the question of whether synergies and complementarities in Amsterdam’s port business ecosystem are relevant for circular activities. This question is relevant as it sheds light on the (ir)relevance of the ecosystem perspective for CE activities in ports. Second, we address the question of how the transition towards circularity is incorporated in the strategy of Port of Amsterdam, the developer of Amsterdam’s business ecosystem. This sheds light on the relevance of this transition for port development companies. Third, we assess whether PoA’s approach in developing CE activities incorporates an ecosystem logic. Finally, we assess whether the transition towards CE has implications for the business model of PoA. This question is relevant given previous research that shows that the circularity transition often leads to changes in business models.
Our study relies on both interview and non-interview data. A number of interviews were held during December 2019 and January 2020 with the head of PoA’s commercial team ‘Circular & Renewable Industry’ and a commercial manager of this team, the latter of whom is also one of the authors of the present article. What started as an interview with the PoA by the other two authors of the paper to discuss the transition to CE in the port evolved into a collaborative undertaking. This led to a deep shared understanding of the context of decision-making in PoA and better data (for the advantages and disadvantages of participant observation, see).
Regarding non-interview data, we have analyzed accessible documents published by PoA that reveal its approach to CE, including its long-term strategy paper, annual reports, and other external communication. The circular activities in Port of Amsterdam were identified from the port’s own list of CE activities, which is available through the website of PoA. The activities of the identified circular activities in Amsterdam were analyzed to get a deeper understanding of the activities, the spatial scale of the value chains and the co-location synergies. In this step, it was also verified that these activities meet the criteria for CE activities deployed in this paper. PoA provided data on the firms involved in circular activities as well as volumes and land use of the circular activities and PoA revenues related to CE.
4.2. Amsterdam’s Port Business Ecosystem and PDC
Amsterdam’s port complex covers over 1400 companies, located in a port area of over 4500 hectares. These companies have over 65,000 employees. The PDC of Amsterdam is called ’Port of Amsterdam’ (PoA). PoA is a publicly owned corporate entity (fully owned by the municipal government of Amsterdam) that operates with a landlord business model: land in the port is leased to private companies. PoA became a commercial entity on the first of April 2013; previously, it was a department of the public municipal administration. All shares are held by the municipality of Amsterdam.
The municipality of Amsterdam has a common shareholder policy for all municipal participation. This policy specifically addresses the objectives for the Port of Amsterdam. While sufficient return on investment is a key policy principle, the municipality does not aim for profit maximization but, in line with other government-owned PDCs, aims to create value for society. The shareholder policy of Amsterdam specifically mentions sustainability as a key interest for its municipally owned corporations. The municipality of Amsterdam has an ambitious strategy with regard to circularity: it aims to become fully circular in 2050, with intermediate targets such as achieving a separated waste delivery rate of 65% in 2020 (up from 19% in 2013) and a strong economic contribution from new circular activities. The municipality of Amsterdam identifies two of its public corporations as central players in advancing circularity: the municipal waste company (Afval EnergieBedrijf, AEB, Amsterdam, The Netherlands) and Port of Amsterdam (PoA).
PoA has a supervisory board with five members, all of whom are independent (i.e., there are no politicians or senior civil servants on the board that specifically represent the municipality of Amsterdam). The supervisory board approves major decisions, and the shareholder has a more limited direct influence: shareholder approval is only needed for strategically important decisions, for instance, regarding mergers, take-overs and very large investments.
4.3. Circular Activities in Amsterdam’s Port Complex
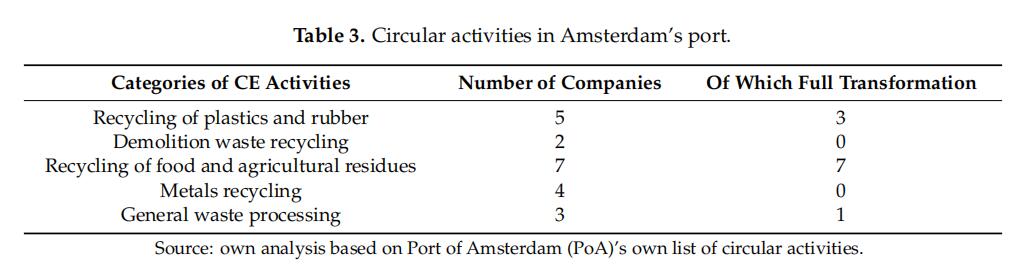
PoA uses a formal classification of the activities in the port into different segments, as the account management and commercial contacts of different segments are handled by different teams. PoA currently classifies 22 establishments as circular. However, one of these, the headquarter of Avantium, a stocklisted circular company, does not meet the criteria applied in this paper, as no circular activities are carried out within Amsterdam’s port business ecosystem, and the headquarter is also not located inside the formal port area. The remaining 21 circular establishments, of which 11 were created in the period 2010–2017, all have a contractual relation with PoA and can be divided into five segments (see Table 3). For each of these, we also assessed whether the activities entail a full transformation of waste into a new product (for instance biofuel) or whether activities involve collecting, sorting and/or processing waste which is then sold to other companies in the circular system (for instance, metal scrap that is sorted, processed and exported as scrap).
In demolition waste and metals, the activities in the port are focused on sorting and processing waste, not on turning scrap into new metals. On the contrary, the recycling of food and agricultural residues leads to a new product, in the majority of cases bioenergy. In general, the most common end product of the circular activities in Amsterdam’s port is energy (either biofuels or electricity). However, the number of firms that create feedstocks or new products from waste has increased over the last years.
4.4. Synergies and Complementarities of CE Activities in Amsterdam
To make an assessment of the synergies between CE activities and other companies in Amsterdam’s port business ecosystem, we have made a distinction between three types of synergies, based on previous work on co-location synergies. First, companies can benefit from a logistics infrastructure and services synergy: companies have relatively cheap inbound and outbound logistics flows because other firms in the ecosystem provide logistics services, enabled by logistics infrastructure. This synergy is due to the location of CE activities in the port, and it can be considered the most general type of synergy: only companies that have local or no inbound/outbound material flows do not benefit from this synergy type.
Second, companies can benefit from input–output synergy when they sell products or purchase resources from other firms in the port business ecosystem. Third, companies can benefit from what we term industrial ecology synergy, in which the exchange of (by)products is enabled by dedicated infrastructure. Only this third type of synergy can be considered as non-generic in the definition of. Table 4 provides a case of each of the three synergy types for the CE activities in Amsterdam’s port and the number of firms that benefit from each synergy type.
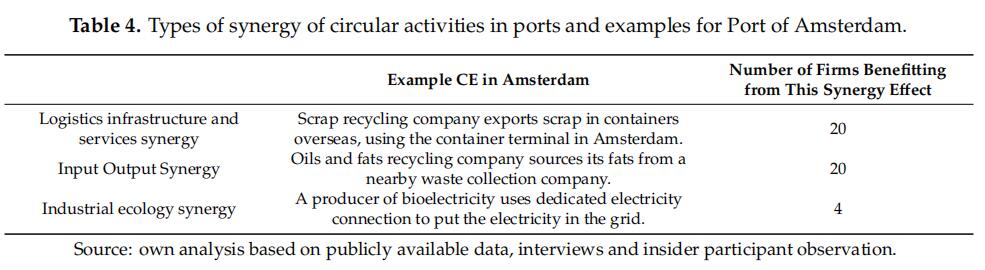
All firms but one benefit from the logistics infrastructure and services synergy. This is straightforward: the presence of logistics infrastructure and services is the reason for locating in Amsterdam’s port complex. Twenty out of 21 firms also benefit from input–output synergy, meaning that virtually all firms either source from or sell material to another firm in the port business ecosystem. This shows the strong interrelations between the CE activities in Amsterdam’s port complex. The co-location benefits apply within Amsterdam’s port business ecosystem as a whole (4500 hectares), but a couple of hotspots have been developed where companies are co-located at the same site to maximize synergies. Most importantly, a site in the eastern part of the port of around 100 hectares hosts five circular companies, with land reserved for another 4–5 CE companies.
The number of firms that benefit from dedicated infrastructure that enables synergies is four (less than 20%). The clearest example is a fruit juice company that sends it sugar-rich wastewater (from washing the fruit) to a biogas conversion plant that converts food waste into electricity and heat while also cleaning the water. There are currently a number of projects in various phases (from idea to operation) to further create synergies through investing in dedicated facilities/infrastructures. The most advanced is a dedicated pipeline to transport the heat generated by the major waste processing company to a biodiesel refinery.
In addition, together with one waste processing company, the Port of Amsterdam is (as of March 2020) investing in a public berth on the southern bank of the Aziëhaven capable of receiving coaster vessels and inland barges and serving the recycling companies located in this area. The geographical situation of this new quay, combined with its public character (i.e., it can be reserved and used by any company, making use of both mobile quay cranes and floating cranes) will allow many different CE businesses in the immediate vicinity to transship both feedstocks and semi-finished or finished products. AEB, SUEZ and BioEnergyNetherlands (BEN), which are all located directly adjacent to the new quay, have expressed their intention to use this facility for the loading and unloading of both dry bulk (i.e., wood chips) and liquid bulk (i.e., liquified CO2 ) cargoes. The realization of this multi-user and multi-cargo infrastructure is expected to stimulate further growth in the number and type of CE activity in this area of the port and generate revenues for PoA in the form of quay rental and port dues.
4.5. CE in the Strategy of the PDC
The relevance of CE in the Port of Amsterdam’s strategy is assessed based on three relevant documents of PoA: first, the long-term port development vision, termed Vision 2030, which was published in 2015; second, the strategy 2017–2021, which translates this vision into actions for a 5-year period; and third the annual report of 2018, which reports on the progress in 2018. The vision 2030 aims to develop the port as a ‘dynamic, diverse, adaptive and metropolitan port business ecosystem’ (p.5 -this and other quotes from Port of Amsterdam are the author’s translation from Dutch). PoA distinguishes three roles for PoA: first, creating an attractive location climate, second, a role as matchmaker that connects organizations and sectors around business opportunities and shared challenges; and third, which PoA clearly states, its role as active developer of new activities that strengthen the business ecosystem (or co-creator, in the terminology of PoA). The vision 2030 explicitly mentions the transition towards circularity and the ambition of PoA to attract new circular economic activities. In the strategy 2017–2021, published in 2016, the circularity ambition is strengthened and translated into clear objectives. Four strategic roadmaps are defined: energy transition, circular economy, logistics accessibility and digitalization. The aim is to lease 22.5 hectares of land in the port to biobased and circular companies. Finally, the annual report 2018 reports the progress in achieving the vision. In the message of the executive board, it is stated that ’2018 was a turning point [ . . . ]. There is a broad societal awareness that change is needed. In the port, sustainable development took off. There were substantial investments in energy transition and circular economy’. In addition, the statement of the supervisory board is also focused on circularity: ‘the supervisory board compliments the port businesses and Port of Amsterdam with strong cargo handling volumes and a clear transition towards more circular activities’. Overall, CE clearly occupies a central role in PoA’s strategy; PoA aims to change and diversify the port business ecosystem by attracting decisively circular activities. PoA also states that given the scarcity of port land, the contribution of tenants to advancing the transition towards circularity and/or sustainable energy is an important factor in land allocation decisions.
4.6. PoA’s Emerging Ecosystem Approach
PoA uses the term ecosystem for the CE activities: ’From waste, raw materials and port logistics to established demo plants and innovative circular businesses, everything comes together in Port of Amsterdam’s ecosystem’. Beyond the terminology, PoA applies three instruments to develop the CE ecosystem. Each of these instruments demonstrates that PoA is taking on a more active role than simply acting as a landlord, much in line with the emerging theories on keystone strategies of ecosystem developers as discussed in Section 3, and in tune with other PDCs.
First, PoA aims to maximize synergies through promoting co-siting and co-location. For instance, in a specific area in the port, where various CE activities are already established, vacant land is reserved for CE activities; PoA would not sign lease agreements with linear activities, even if they would prove more attractive from a strictly commercial viewpoint. Second, PoA invests in infrastructure that creates synergies between all players. As a first example, PoA is currently investing in a public berth adjacent to various CE activities. Through this investment, PoA enables these companies to bundle volumes. As another example, PoA invested in the pipeline that enables sending the sugar-rich wastewater to the processing company, creating savings as well as environmental benefits. The third active role of PoA to strengthen the ecosystem is by supporting innovation and incubation. PoA provides an incubation facility (Prodock) where companies develop demo projects for circular processes, with support from PoA. In addition, PoA actively supports some new ventures; in one specific case, PoA decided to invest venture capital in a CE start-up. All in all, these cases show that PoA invests to attract and support innovative new CE companies.
4.7. Implications of the Circularity Transition for the Business Model of PoA
Like most PDCs, PoA currently has two principal revenue streams: port dues and land rents. One central issue is the extent to which a transition to a circular economy goes hand in hand with lower cargo volumes, which would have direct effects for PoA’s revenue streams from port dues. In order to assess the maritime transport flows associated with CE activities, the spatial scale of circular value chains is assessed.
In our analysis of spatial scale, we distinguish between continental and overseas, not between national and international, as this allows us to more easily and clearly distinguish cargo flows within mainland Europe (not including the UK) and cargo flows travelling overseas. This is because of the importance of overseas flows for the port and because Belgium and to a lesser extent Germany are relatively close to Amsterdam, thus limiting the relevance of the national vs. international distinction. We furthermore analyze the spatial scale for the five segments, not for the individual CE activities, as the precise origins and destinations change rapidly; many waste products are traded as commodities (see Table 5).
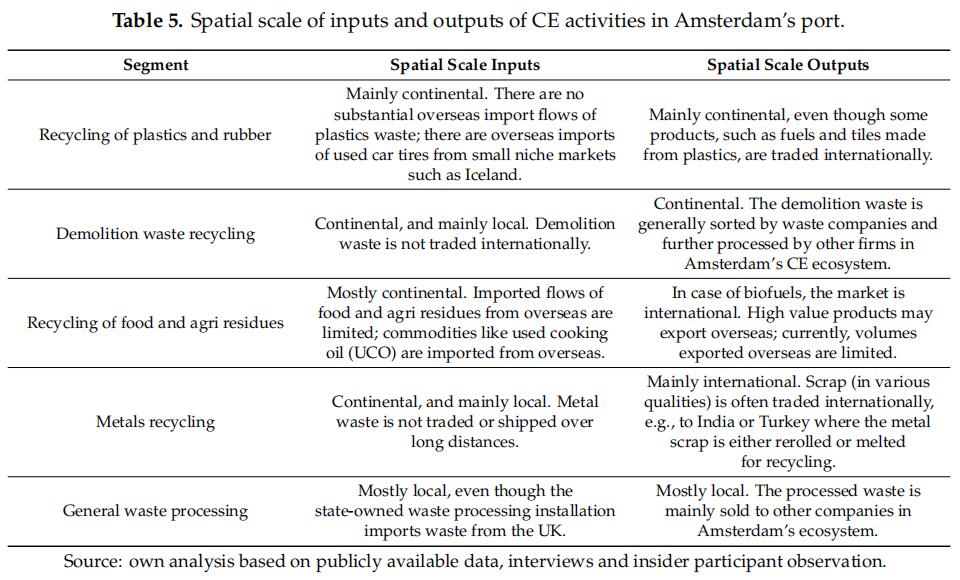
Table 5 shows that, in the current situation, CE material flows are much more local than the traditional end-of-lifecycle flows. Only the scrap flow and liquid biofuels are traded internationally. The maritime volumes generated by the CE activities in Amsterdam are limited to about 3% of total maritime volumes. However, the share of CE activities in the total land use of the port is much higher at 11.6% in 2019. Figure 1 shows the evolution of the revenues from circular activities in the period 2013–2019 (for the port dues that come from CE activities the year 2010 is added; for the other two, these figures were not available).
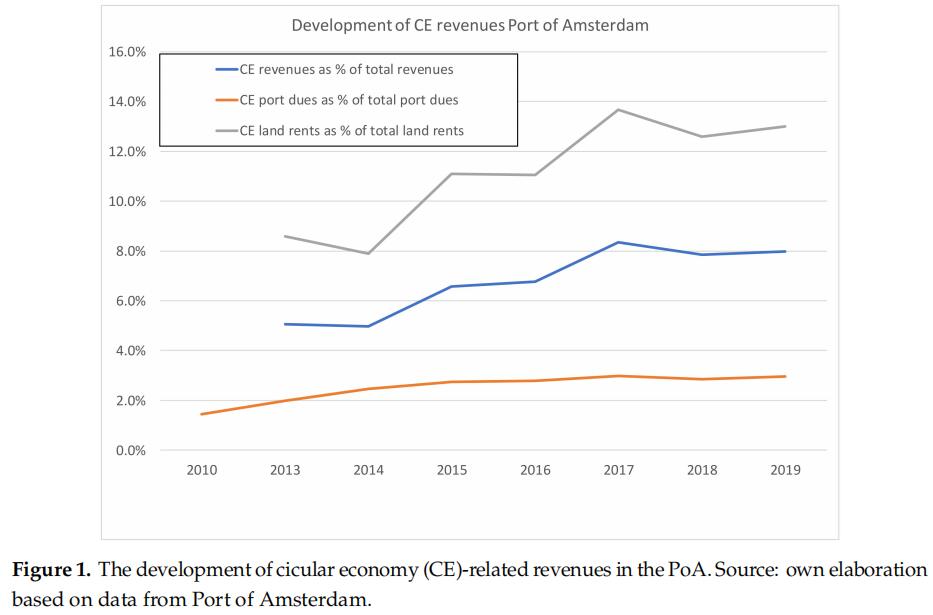
Figure 1 shows that revenues from CE activities have grown rapidly over the last years. CE activities now account for more than 8% of PoA’s total revenues. In terms of growth contribution, the relevance of CE activities is larger: one-fifth of PoA’s revenue growth between 2013 and 2019 stems from CE activities.
In line with the overview above, the data show that land lease revenues are much more important than port dues. For the CE activities, land revenues are 7.5 times higher than port dues, compared to less than 1.5 for total land revenues compared to port dues. This suggests that the transition to CE will go hand in hand with lower throughput volumes and thus lower revenues from port dues. This may explain why PoA mentions in its strategy 2017–2021 that the transition from linear to circular has implications for its business model: land lease revenues become much more dominant compared to port dues. In this respect, it is worth mentioning that so far, the transition towards a circular economy, at least for PoA, has not led to a decline in total throughput volumes. Instead, volumes based on linear flows have grown from about 70 million ton to about 85 million ton in the period 2013–2019. However, a decline of these linear volumes may well be on the horizon: 15 million tons of Amsterdam’s total throughput consists of coal, and 50 million tons consists of oil products. Further progress of the CE transition is likely to further reduce the importance of port dues (which in 2019 accounted for 36% of PoA’s total revenues). Figure 2 shows the evolution of the land rent incomes per hectare, for both the CE activities and the traditional linear activities.
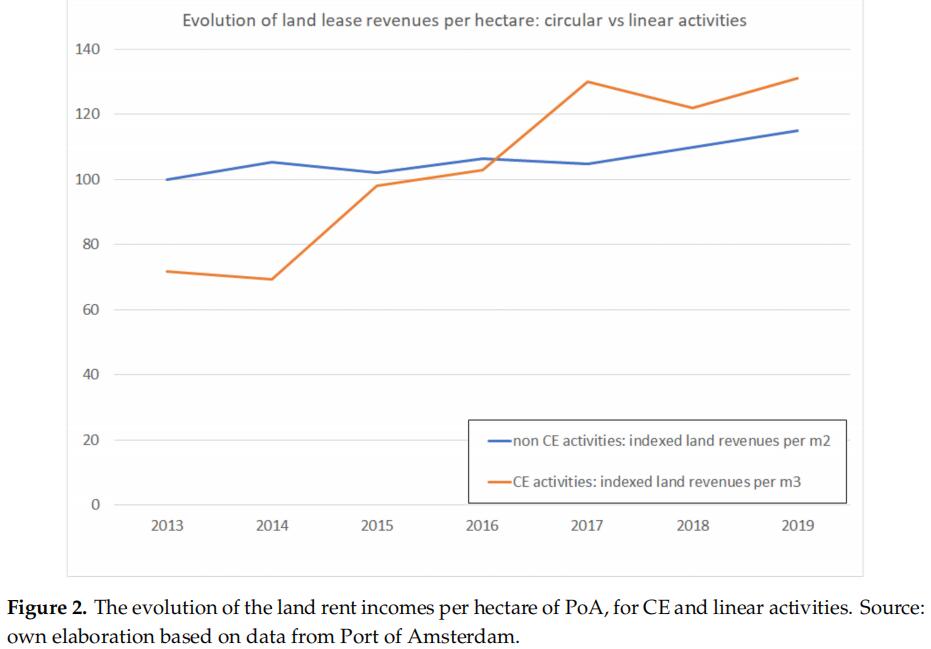
Figure 2 shows that while initially the land lease incomes per hectare for CE activities were about 30% lower than for linear activities in 2013, in 2019 they were 15% higher. This is a significant development in a relatively short period. Two relevant factors to consider in this regard are, first, the use and continuous development of tenant incentives, which were introduced by Port of Amsterdam as a commercial instrument to attract CE companies, and second, the increasing attractiveness of Port of Amsterdam’s circular and renewable industry business ecosystem.
Many of the new CE activities are only able to generate revenue once they have secured a location, secured (environmental) permits, invested in processing facilities and tested these processes. The substantial time lag between signing a lease contract, receipt of permits and the first revenues poses a challenge for the companies aiming to commercially exploit innovative recycling and upcycling technologies. Without a suitable physical location (either rented for the short-term or in a long-term lease from Port of Amsterdam), it is not possible to apply for an environmental permit. In turn, investors and banks are reluctant to commit to financing a project that is not yet environmentally permitted. To overcome this stalemate (no location, thus no permit, thus no financing, thus no means for a rent/lease agreement), the Port of Amsterdam has developed a series of tenant incentives, which allow new CE companies to lay claim to a plot of land (either in option or fully contracted) without high levels of expenditure (either capital expenditure—CAPEX—or operational expenditure—OPEX) in the start-up phase.
PoA uses the following methods, all of which abide by EU competition policy prohibiting state aid, to facilitate the establishment of CE activities in the port area:
1. Paid option on a plot of land in the port. If a company is not yet able to sign a long-term rental or long-term lease contract, it can take a paid option (25% of the normal price) on the plot of land it is looking to develop. The company cannot start physically developing the plot, but it can make plans and start the permitting procedure in the knowledge that the land will not be rented out or leased to a third party.
2. Start-up discounts. A new company does not start generating revenue until its activity is (environmentally) permitted, designed, built, commissioned and up and running. The Port of Amsterdam can provide temporary discounts to new tenants to reduce OPEX until a new activity is operational and revenue streams have started flowing.
3. Delayed payment. For companies that plan to scale up processing capacity (i.e., in the case of phased increase in production from, say, 100 tons per day to 600 tons per day), the initial revenue streams may not be enough to sustain full lease payments. For these parties, PoA offers delayed payment of the land rental or lease fees. Like the above-mentioned growth agreement, this method reduces OPEX for the activity in the startup and/or growth phase of the operation. The delayed payment is paid back to Port of Amsterdam at a later date or spread out across the duration of the land rental or land lease contract. To ensure that this incentive tool adheres to is EU state-aid regulation, PoA charges a market conform interest over the amount for which payment is delayed.
4. Subordinated loans. Port of Amsterdam occasionally provides new companies and activities with subordinated loans, in partnership with local investment funds. These loans provide the funding to get a new activity built and operational. Like with the other mechanisms, the interest is market-based to adhere to EU legislation. One of the reasons for partnering with public investment funds is their expertise in due diligence and contractual agreements.
These instruments were used to attract CE activities. Thus, initial lease revenues were low and have grown over time.
As for the second key factor to explain the increase in land lease income for circular activities, the expanding circular and renewable industry business ecosystem in Port of Amsterdam has enabled PoA to negotiate higher land lease fees in the most recent land lease agreements. Overall, this evolution suggests that the tenant incentives developed for attracting circular and renewable industry activities, with competitive prices to develop a CE ecosystem that can sustain higher income in the longer run, have been successful.
5. Conclusions
This paper has provided an overview of CE activities in European ports and provided a detailed overview of circular activities in Amsterdam’s port complex. Seven conclusions were found.
1. Our population-level assessment of CE activities in European Core and Comprehensive ports shows that ports in Europe do indeed attract CE activities. However, there are huge differences between the ports, and large ports in linear activities do not automatically also attract circular activities. Furthermore, there are important regional disparities in Europe regarding the speed of the CE transition in ports.
2. Amsterdam is a frontrunner in the CE transition in ports, with over 20 circular activities across five segments and substantial growth in CE activity over the past couple of years.
3. A circular and renewable industry business ecosystem has emerged in Port of Amsterdam and continues to evolve. Three types of synergies between the companies in this ecosystem can be distinguished. The vast majority of CE companies benefifit from a logistics infrastructure and services because other firms in the ecosystem provide logistics services, enabled by logistics infrastructure. Almost all CE companies also benefit from input–output synergy that arises through sales to or purchases from other firms in the port business ecosystem. Finally, less than 20% of Amsterdam’s CE companies also benefit from industrial ecology synergies, in which the exchange of (by)products is enabled by dedicated infrastructure.
4. The spatial scale of the CE value chains varies between segments but is in general less international than linear value chains; resources (in the form of waste) are often confined to the hinterland of the port, and often transported to the port by truck. Outputs of CE activities, either in the form of new products or in the form of sorted waste, are in some cases traded internationally, but often mainly reach continental markets within the European trading bloc. Amsterdam’s maritime circular volumes amount to about 2.5 million tons, around 3% of total volumes, while CE activities account for around 11.5% of the total land use in Amsterdam’s port.
5. PoA, the government-owned landlord port development company, gives developing CE activities a central place in its strategy. Circularity is mentioned frequently in PoA’s long-term vision, its five-year corporate strategy and its recent annual reports. PoA also reports land use for CE activities and has allocated a part of the port area for CE activities. PoA’s focus on CE is in line with the ambitions and policies of its shareholder, the municipality of Amsterdam, which also includes the challenge to shift to a circular economy in its shareholder policy.
6. PoA takes on new and active roles in advancing the circular business ecosystem. Most notable are PoA’s active role in developing industrial ecology synergies through investments in infrastructure to better connect the companies in the ecosystem and its role in nurturing and attracting new companies through an incubator facility as well capital provision (through loans and in one specific case equity).
7. The transition towards CE goes hand in hand with a transition of PoA’s business model, with an increasing focus on new services that create synergy and a decreasing importance of the share of port dues in the total revenue mix.
These conclusions deepen our understanding of the impact of the circularity transition on ports. However, the findings from our study of Port of Amsterdam, as well as a limited number of other case studies on CE in ports, are context-dependent and conjunctural, and hence other ports may achieve similar outcomes in terms of CE, even if their conditions (e.g., the stage of business ecosystem development or the apposition with the visions of main shareholders) are different than those of PoA.
Three further research themes on circularity and port development are particularly relevant: first, developing detailed datasets on circular activities in ports, to allow cross-section and analysis of drivers of CE in ports; second, comparative research, or even comparative-historical analysis sensitive to contextual differences, addressing the emergence of port related incubation and start-up support services in ports and the further role of port development companies in the transitioning towards CE is called for. Many ports have embraced innovation as a key mechanism to transition the port business ecosystem towards more circular and sustainable ecosystems (as manifested by the innovation initiatives in various ports, often under the label ’smartport’). More comparative research on the efforts to nurture CE firms can shed light on its impact on the transition of ports. Finally, more detailed research on the effect of public ownership, and especially mechanisms through which public ownership may translate in more focus into attracting circular activities to the port, would yield important insights.
RECOMMENDATION

 Hotline
 Email
Email

 沪公网安备 31011502016705号
Disclaimer:
This communication has been prepared for general information only. To the maximum extent permitted by law, E-PORTS and its affiliated companies, its and their employees, directors, agents, contractors (of any tier) and partners shall not be liable for any loss, claim, charge, damage, liability or damages howsoever arising in connection with the information even if advised of the possibility of damages. The use of the information shall be at your sole risk. Information contained herein comes with no representation or warranty (express or implied) and specifically is not represented or warranted to be correct, complete, accurate or up to date. The information is provided on an “as is” and “as available” basis and is not intended to be relied upon in any way. You shall be solely responsible for the selection, use, efficiency and suitability of the information.


 Chat with us